Our collaboration with Mongabay-India began in October 2021, with the objective of enhancing their stories with our spatial analysis expertise. This blogpost documents the articles we’ve worked on together in May and June 2023.
A hill town in Nilgiris district pays the price for poor waste management

Map of the Nilgiri Biosphere Reserve.
Kotagiri town in Nilgiris district is experiencing a rise in human-wildlife interactions due to fragmented forests, open dump sites, and landfills that attract wildlife. The Nilgiris district is landlocked in the Western Ghats region and consists of a fragmented forest area. However, it falls within the Nilgiris Biosphere Reserve, which aims to promote human-animal coexistence through its core, buffer, and transition zones.
[Explainer] What are floodplains and how have they been managed in India?
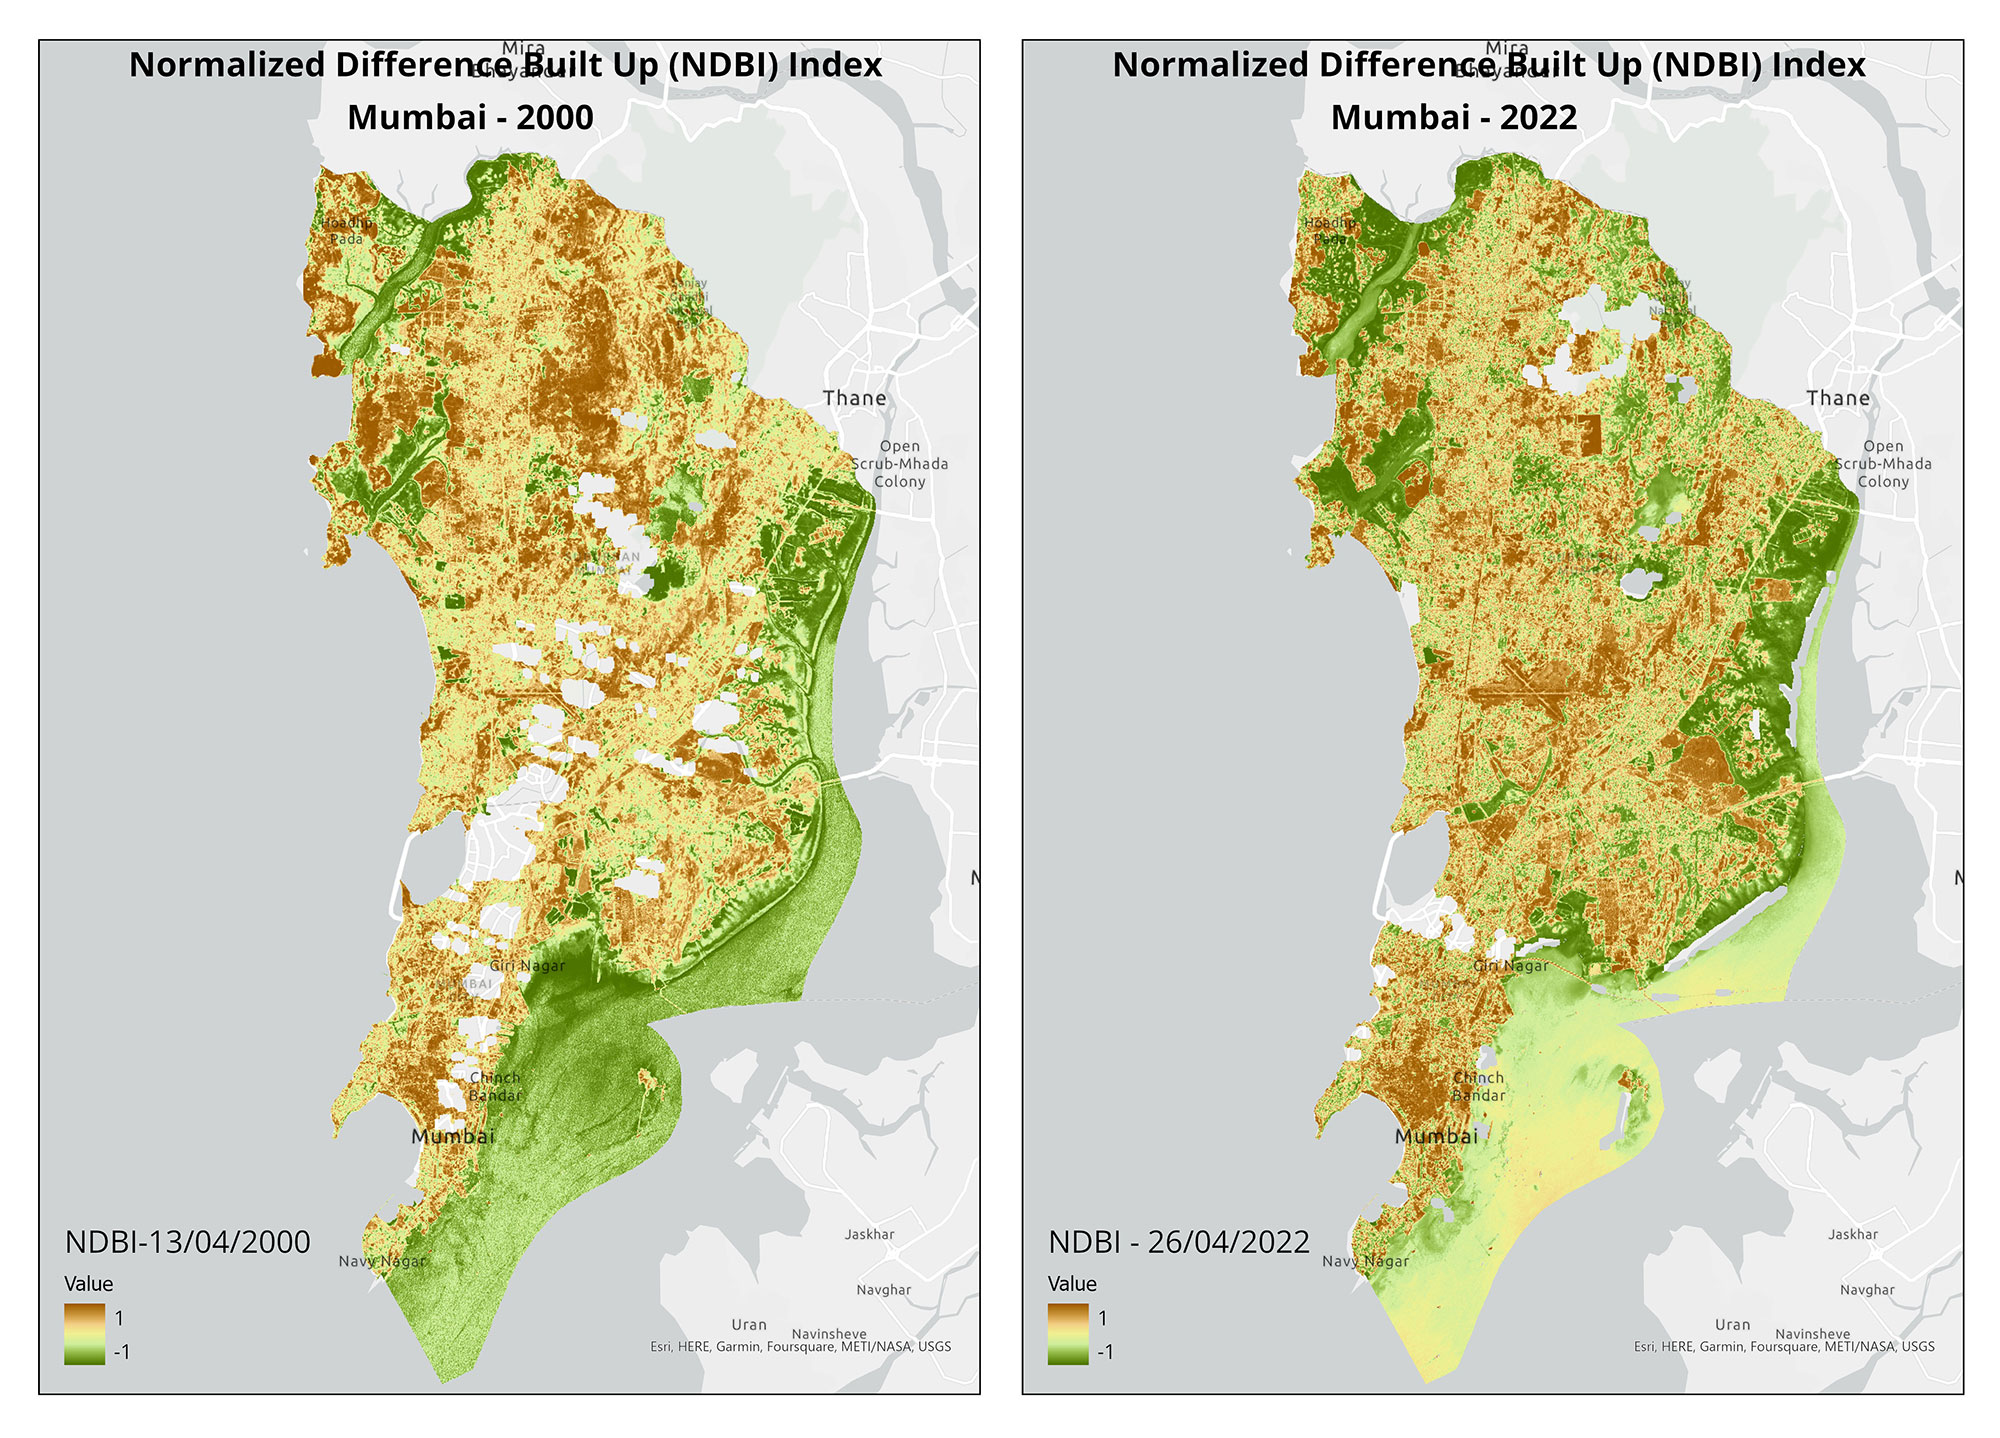
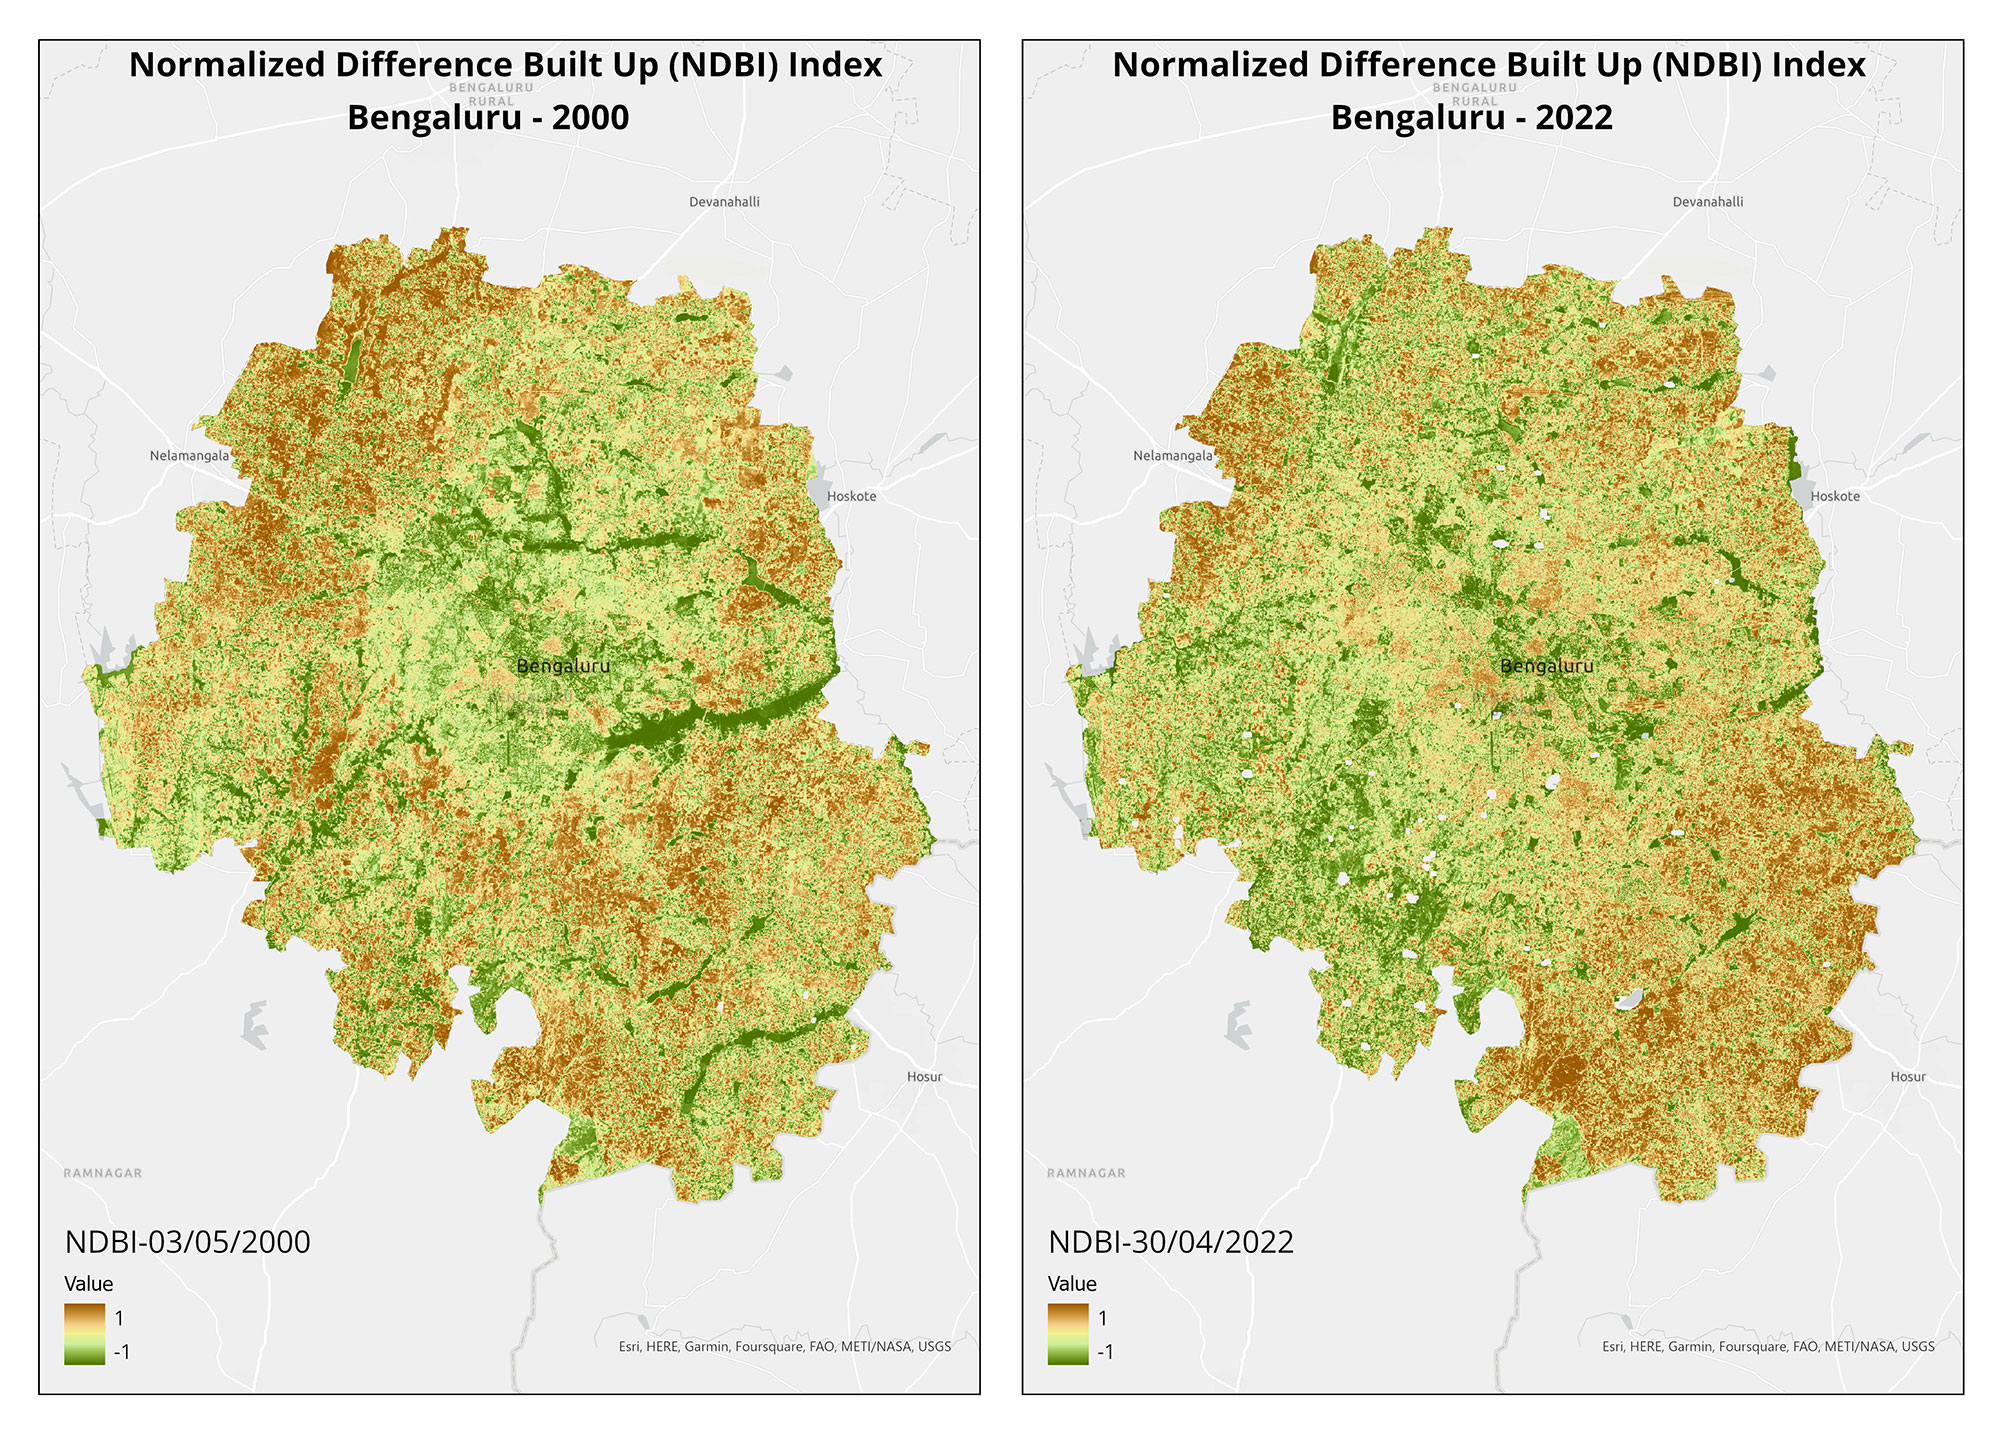
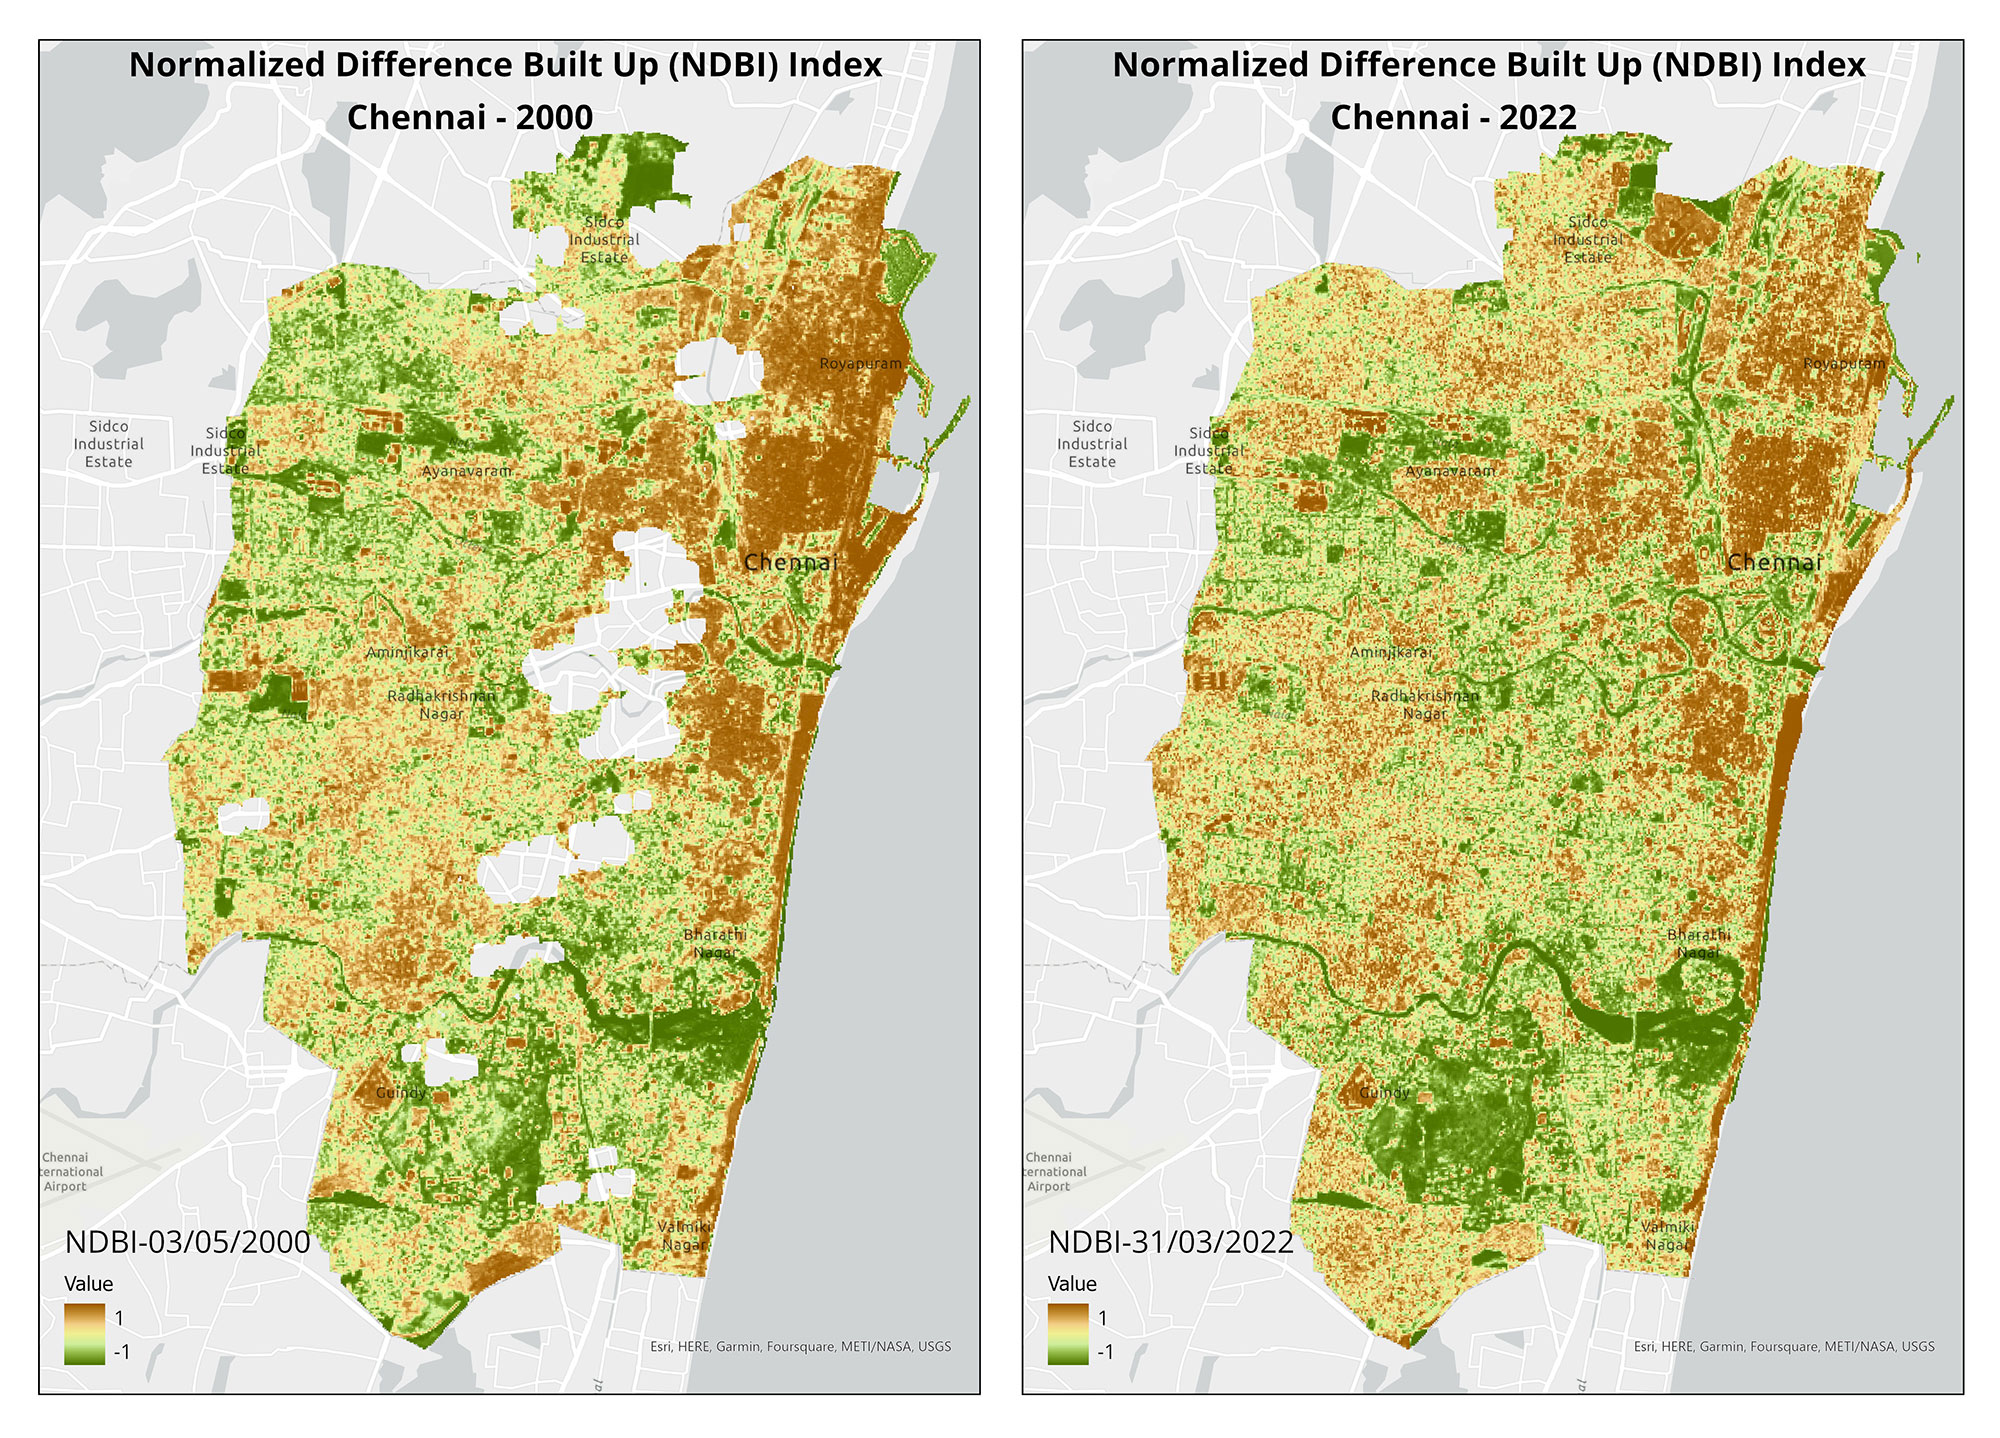
India is highly susceptible to flooding, and the situation worsens due to construction in floodplains. Only a limited number of states have floodplain zoning policies, and experts emphasise the importance of implementing these laws in other flood-prone states. To visualise the impact of development in floodplains, we utilised open-source satellite imagery to study flooding in two regions of India.
We didn’t start the fire? Speculations over cause of Goa forest fires continue; state plans recovery
Goa experienced devastating forest fires in March 2023, resulting in the destruction of 418 hectares of land and causing significant harm to biodiversity and ecology. The cause of the fires remains uncertain, with speculation ranging from slash and burn techniques to high temperatures and scarce rainfall. Cashew farmers affected by the fires deny their involvement and seek compensation.

Map representing burn scars obtained by analysing pre and post-fire conditions from February and March 2023, respectively.
Experts suggest preventive measures like fire lines and rainwater trenches. Over a 10 to 12-day period, 74 fire incidents were reported, affecting wildlife sanctuaries and surrounding villages. A total of 418 hectares, including forest land, were destroyed.
The Himachal Pradesh Forest department's Chamba circle issued an order in November 2022 acknowledging that tree plantations along migratory routes hinder pastoralists' access to quality fodder. Local pastoralists welcomed the order but called for its extension to other forest circles. The adherence to the current instructions from the grazing advisory committee to cease such plantations, have been lacking.

Migratory routes of pastoralists and the tree plantations on their path that pose as hurdles.
Afforestation activities in Himachal Pradesh have increased vulnerability for pastoralists, leading to invasive species expansion and disruption of seamless connectivity to green pastures. The Chamba circle's order aimed to address these concerns and aligns with prior research highlighting the hardships faced by pastoral communities due to hindrances in accessing green pastures during their seasonal migrations.

Migratory routes of pastoralists and the tree plantations on their path that pose as hurdles.
The information regarding pastoralists was obtained from an order by the Himachal Pradesh Forest Department. As per department records, 2,809 plantations took place in the state between January 2016 and July 2019. Data for 785 plantations were missing, as per a study. The maps represent 384 plantations in Chamba Circle with complete data.

Migratory routes of pastoralists and the tree plantations on their path that pose as hurdles.

The Dhapa land was originally part of the East Kolkata Wetlands, which serves as Kolkata’s natural sewage treatment system and was designated a Ramsar site in 2002, as a wetland of global importance.
The Dhapa landfill in Kolkata has been a source of frequent fires and declining air quality since 1987. To address this issue, the National Green Tribunal recommended biomining and bioremediation methods for waste clearance. However, progress has been slow, with only 0.78 million tonnes out of 4 million tonnes processed as of February 2023.

Landfills contribute to global warming due to methane emissions, and the target of clearing Dhapa by June 2024 is uncertain. The state government must clear the remaining 80% of waste within a year to meet the recommended deadline or face penalties.

The landfill's fires have caused health problems, with PM10 concentration exceeding standards. Municipal solid waste landfills rank as the third-largest source of methane emissions, exacerbating fires and worsening air quality.
(Note: This is the eighth blog in the series, on our collaboration with Mongabay-India. Read the previous blog here, and the first in the series, here.)