We began our collaboration with Mongabay-India to enhance their stories with our spatial analysis expertise. Our shared objective to diversify environmental awareness to communicate to a larger audience continues as we embark on our second year of collaboration.
From October 2021 to June 2022, we’ve worked together to produce 30 maps and map-related/cartographic media for 23 stories in 11 different verticals by Mongabay-India. This blog documents the final set of articles we visualised together from October 2021 to June 2022.
[Illustrations] Why are temperatures within a city’s neighbourhoods different?
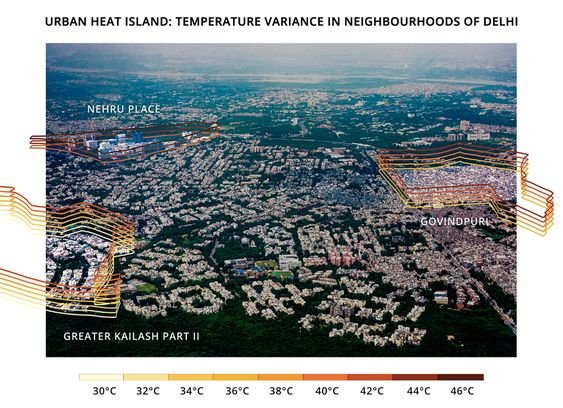
The minimum and maximum surface temperatures of three Delhi neighbourhoods with varying socio-economic and physical characteristics were taken around noon on May 3, 2021. The range of temperatures in a given neighbourhood is stacked in intervals of two degrees Celsius and represented in the illustration. Illustration by Alisha Vasudev/Mongabay.
Urban Heat Islands in a city can have different temperatures not only between the city and its surrounding areas, but within a city itself.
We gathered data from different neighbourhoods in Mumbai and Delhi, using Landsat 8 ST_B10 band and processed the data using Google Earth Engine. Alisha Vasudev/Mongabay has illustrated the range of temperatures in a given neighbourhood for recorded minimum and maximum surface temperatures at a given time, on a regular summer day in 2022.
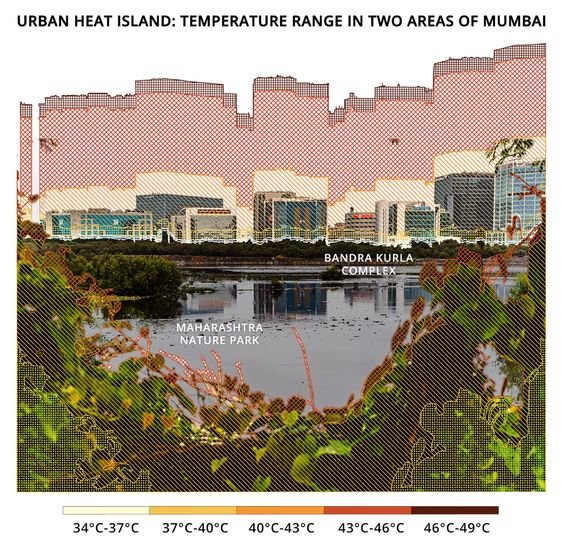
The minimum and maximum surface temperatures of two Mumbai neighbourhoods, with different physical characteristics, were recorded at 11 am on April 15, 2021. This illustration shows which temperature range (in intervals of three degrees) is recorded in what percentage of the area in each of these neighbourhoods. Illustration by Alisha Vasudev/Mongabay.

Maximum Land Surface Temperature in India, 01 March - 31 May 2022
According to experts, India's heat action plans need to incorporate long-term measures including efforts to decrease indoor temperatures, be regularly monitored and updated, and be more proactive to decrease heat stress.
(Note: This is the fifth blog in the series, on our collaboration with Mongabay-India. Read the previous blog here, and the first in the series, here.)