Conservation Cartography with Mongabay-India (Part-II)

In 2021, we began collaborating with Mongabay-India to enhance their stories with our spatial analysis expertise. Our joint goal is to use diverse storytelling formats to expand conservation awareness and reach a wider audience. This blogpost documents the second set of articles we’ve worked on together between January 2022 - March 2022

Birds in Delhi ponds remind us why we should not ignore small urban wetlands

The 39 ponds surveyed by the researchers had negligible historical data and observations recorded through citizen science platforms.

The 39 ponds surveyed by the researchers had negligible historical data and observations recorded through citizen science platforms.

This article makes note of Delhi's rich urban biodiversity recorded in its ponds amid housing colonies, parks while underscoring the need to pay attention to urban water bodies beyond protected wetlands.


Given land for power, Pavagada residents now powerless

Pavagada Solar Park, about 160 km from Bengaluru, spreads across 13,000 acres

In 2015, Pavagada was chosen as the location for Shakti Sthala - Karnataka’s most ambitious solar power project. Pavagada Solar Park, about 160 km from Bengaluru is spread across 13,000 acres. This article discusses the impact of India’s largest solar park that is experimenting with a new model of leasing land from farmers. 

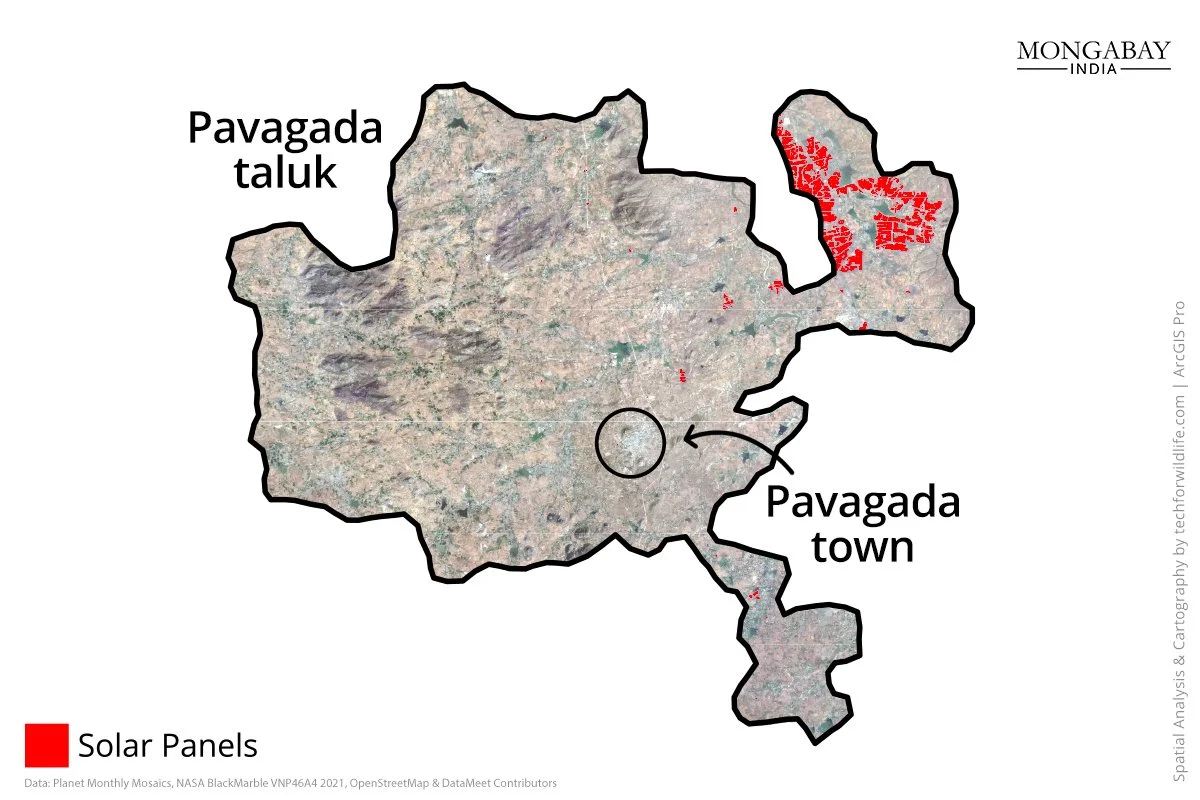
Scale of Pavagada Solar Park in Pavagada Taluk

A night light map of Pavagada Taluk and Bangalore City

A night-light map of Pavagada Taluk and Bangalore City highlighting the contrast in available resources.


The ignorance of the Haryana government has cost the Aravallis dearly

Dadam stone mine location in Haryana where five people were killed in a landslide in January 2022. It was just the second day of full-fledged mining activities after a long ban.

A report on the impact of unchecked mining processes in Aravallis flouting prescribed rules and threatening local ecology. The article reports on the violations of conditions of environment clearance and approved mining plan and the impacts of the same. 

We worked on the locator map for Dadam stone mine and other mines within the Haryana Aravallis.

Grasses spur mangroves to grow in an erosion-riddled Sundarbans patch

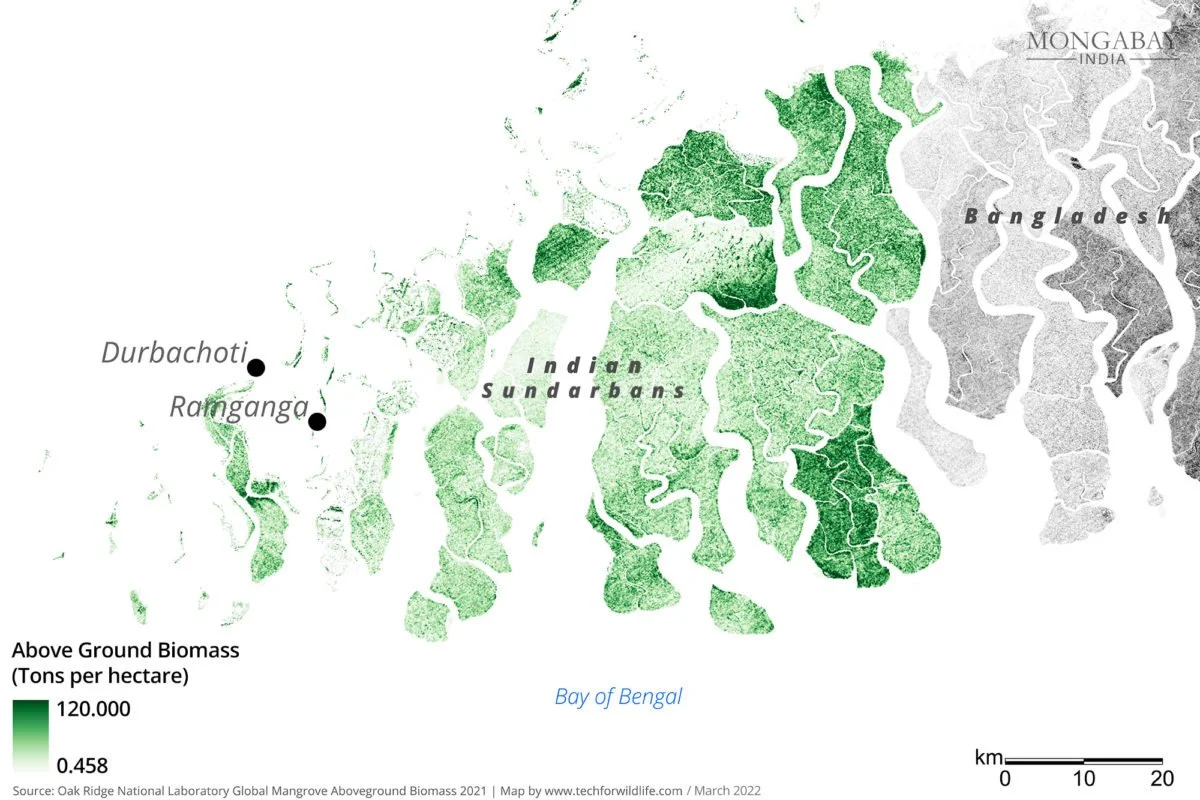
The above ground biomass in the Sundarbans

New research shows that Sundarbans mangroves, already at risk due to climate change, sea-level rise and land-use changes, are beginning to fast erode. 

We worked on a map that indicates the above ground biomass in the Sundarbans for all living biomass above the soil including stem, stump, branches, bark, seeds and foliage. Mangroves are vital for carbon storage and most of this carbon is stored in the soil beneath mangrove trees.

Oil palm expansion in northeast India gives rise to human-elephant conflict concerns

Extent of IUCN Elephant Habitat Range with forest cover in Goalpara, Assam

This article reports on the expansion of oil palm in northeast India that encroaches on forest land leading to an increase in human-elephant conflicts.

Districts Proposed for Palm Oil Cultivation

The Assam government has plans to start oil palm cultivation in 17 districts, including heavily forested districts like Karbi Anglong and Dima Hasao.

(Note: This is the second blog in the series on our collaboration with Mongabay-India. Read the first blog here)

On Hiring at TfW Foundation

In September 2021, we put out calls for applications to fill three positions at Technology for Wildlife Foundation. As of January 1st 2022, we have a team of five full-time staff, as well as a number of consultants and volunteers working on specific projects. This post describes the remote process we used to select and hire our new staff members at the tail-end of 2021.

Sankey Diagram depicting the application process for all the applications at TfW Foundation in Sep-Dec 2021.

Sankey Diagram depicting the process for all the candidates across all three advertised positions.

We had a clear idea of the positions ready in early 2021, which were incorporated into our requests for funding. Once our funding was secured, we prepared detailed job descriptions which were used to inform the Google Forms that were our first point of contact with our applicant pool.

A screenshot of a section of the Conservation Geographer application form.

Our call for applications was straightforward; we provided information about the job profile, the salary range and the requirements of the position, as well as of the required and preferred skillsets. At this stage, we asked the applicants to provide their name, their CV and to answer just one question: in their own words, why did they want to work as the <advertised role> at Technology for Wildlife Foundation. For the communicator role, we also asked for a link to an illustration/design portfolio.

We sent out the call for applications, along with the link to the website page, on our social media channels as well as through our networks. Applications were open for a two-week period, from September 6th 2021 through to 20th September 2021. We received a total of 232 applications for all three positions, which exceeded both our expectations as well as our capacity to process them within our expected schedule. We had 50 applicants for our Conservation Communicator position, 90 for our two Conservation Geographer positions and 92 for our Ghost Gear Research Consultant.

Sankey Diagram depicting the process for the Conservation Communicator position.

Our initial set of eliminations was based solely on their answer to our singular question. We weren’t looking for command over the language, length or even expertise. This round was simply about understanding whether the candidate had put some thought into answering the question, along with an understanding of our purpose at TfW Foundation. Candidates whose answers solely expressed an interest in drones or maps, without any interest in conservation, or conversely, those which expressed an inchoate interest in wildlife or conservation, with no reference to our approach, were eliminated at this stage.

Sankey Diagram for the Conservation Geographer positions, including the test component.

For the second round, we looked at the CVs of the remaining candidates, and used an interview matrix, with a point-based system, to assess whether they had the required and preferred skills as advertised. Based on this, we were able to reduce our candidate pool. We also provided our Geographer candidates with a technical test, and reduced that pool of candidates further, from 18 to 7.

We then conducted semi-structured interviews with those remaining at this stage. Our goal here was to find candidates whose interests, motivations and career aspirations were aligned not just with us, but with the role they’d applied for. A primary requirement was that they would be capable of working independently and with minimal supervision; while this is my personal preference in terms of work culture, it’s also essential when operating during a pandemic.

Sankey Diagram depicting the process for the Ghost Gear Research Consultant position

For each of these final candidates, we re-assessed their CVs, their answer to our initial question and their professional conduct as expressed over emails and during the interviews. Clear preferences emerged, and we prepared a short-list of our candidates. Each candidate at this stage was asked to connect us with their referees, who we communicated with over email. The sole purpose of the reference check was to verify whether the candidates had portrayed themselves honestly over the course of their interactions with us.

Finally, in early November, we were able to make our first offers! Once we finalised a position and closed applications, we sent out an email to every candidate who applied, letting them know that we would not be taking their application forward. Our final employee joined us on January 1st 2022, and we were able to close this, the second phase of our hiring process.

We deliberately chose to make the salary range visible at the beginning of the application process, and to ask for references only towards the end of the process. There’s enough information out there, as well as substantial anecdotal experience (shout-out to www.reddit.com/r/antiwork), to indicate that this works to the benefit of both applicants and to the hiring organisation.

P.S.: The Sankey Diagrams were made by our Conservation Communicator, Nancy Alice, using SankeyMATIC.

Conservation Cartography with Mongabay-India (Part-I)

In 2021, we began collaborating with Mongabay-India to enhance their stories with our spatial analysis expertise. Our joint goal is to use diverse storytelling formats to expand conservation awareness and reach a wider audience. This blogpost documents the first five articles we’ve worked on together, starting in October 2021.

Stone mining in Brahmagiri mountains chips away at the Godavari River ecosystem

Location of the Brahmagiri mountains and Santosha-Bhagadi hills near Nashik city in Maharashtra. Reserve map boundary by Nashik Forest Department.

This article highlights the human interventions in the natural flow of the Godavari and the subsequent impact on its ecosystems. We worked on a map depicting the Brahmagiri mountains and the Santosha-Bhagadi hills near Nashik city in Maharashtra.

From pollution to power, what stops paddy straw from becoming the fuel of choice

Spatial data on fires in Punjab and Haryana was acquired by the VIIRS instruments on the Suomi National Polar-orbiting Partnership and the NOAA-20 satellites. Each fire pixel represents the centre of a 375m x 375m area that contains actively burning fires.

The article walks us through farmers' management of surplus paddy straw, the cost, the options of using the same to produce energy at biomass power plants and biogas units and why farm-fires are a common instance post- harvest season in North India.

The above visualization from spatial data on fires in Punjab and Haryana was acquired by the VIIRS instruments on the Suomi National Polar-orbiting Partnership and the NOAA-20 satellites. Each fire pixel represents the centre of a 375m x 375m area that contains actively burning fires.

PM 2.5 indicator in Punjab and Haryana during the stubble burning season.

PM 2.5 indicator in Punjab and Haryana during the stubble burning season. The darker the pixel, the greater the concentration of PM 2.5. This map was created using CAMS ECMWF (Copernicus Atmosphere Monitoring Service European Centre for Medium-Range Weather Forecasts) PM2.5 data processed in Google Earth Engine. We have a separate blog post describing the technical process behind this visualisation here.

Chennai’s fight to preserve its wetlands and stay above water

The report notes the importance of conserving freshwater marshes that act like sponges storing the heavy monsoon rains and releasing water during dry months. It also reports the efforts from the government of Tamil Nadu to conserve the Pallikaranai marsh, the last remaining freshwater marsh in Chennai. We worked with Mongabay-India to visualise Pallikaranai Wetlands shrinking acreage from 2450 ha in 1991 to 700 ha today.

Return of the tiger at West Bengal’s Buxa tiger reserve

Buxa Tiger Reserve

An adult male tiger was recently recorded on a camera trap in Buxa Tiger Reserve in north Bengal after 23 years. Mongabay-India writes on the ecosystem restoration activities in the Buxa Tiger Reserve, including grassland management that experts say helped bring the tiger back to the protected area.

We worked on a locator map for Buxa Tiger Reserve (BTR) located in Alipurduar district of West Bengal which is contiguous to Phibsoo Wildlife Sanctuary, Bhutan in its north. 

Snakes in Bengaluru city

Urban Expansion in Bengaluru district

The report weighs movement of snakes and other urban wildlife against the rapid urbanisation of Bengaluru. We worked on visualising the rapid urbanisation of Bengaluru district from 1995-2020. Water bodies and vegetation cover decrease as urbanisation increases.

(Note: This is the first blog in the series on our collaboration with Mongabay-India. Read the second blog here)