Reflections on 2023

TfW with collaborators in Mhadei, January 2023.

2023 was definitely a very unusual year at TfW. The year began in full steam- with workshops, conferences and lots of field work with travel. We were then suddenly presented with a situation nobody anticipated- finding ourselves without Shashank Srinivasan, our Founder-Director. While it was a year of irreplaceable loss, it came with its own learning and growth. This blog is a reflection of what it has been like navigating this change over the last few months.

When faced with this situation of suddenly being without our team leader, I found myself in a new position of leadership. The very first thing was to see if the organisation-really the people, a small team – remained motivated to keep going. Without hesitation, the entire team was sure of wanting to continue work and see projects through. It was a relief that we all felt this way, and I understood what it meant to be a mission-aligned organisation. We believed in the work we were doing, were motivated by it and unwilling to let it go. It strengthened my own belief in the work we did, that nobody needed any convincing to stay in a period of uncertainty.

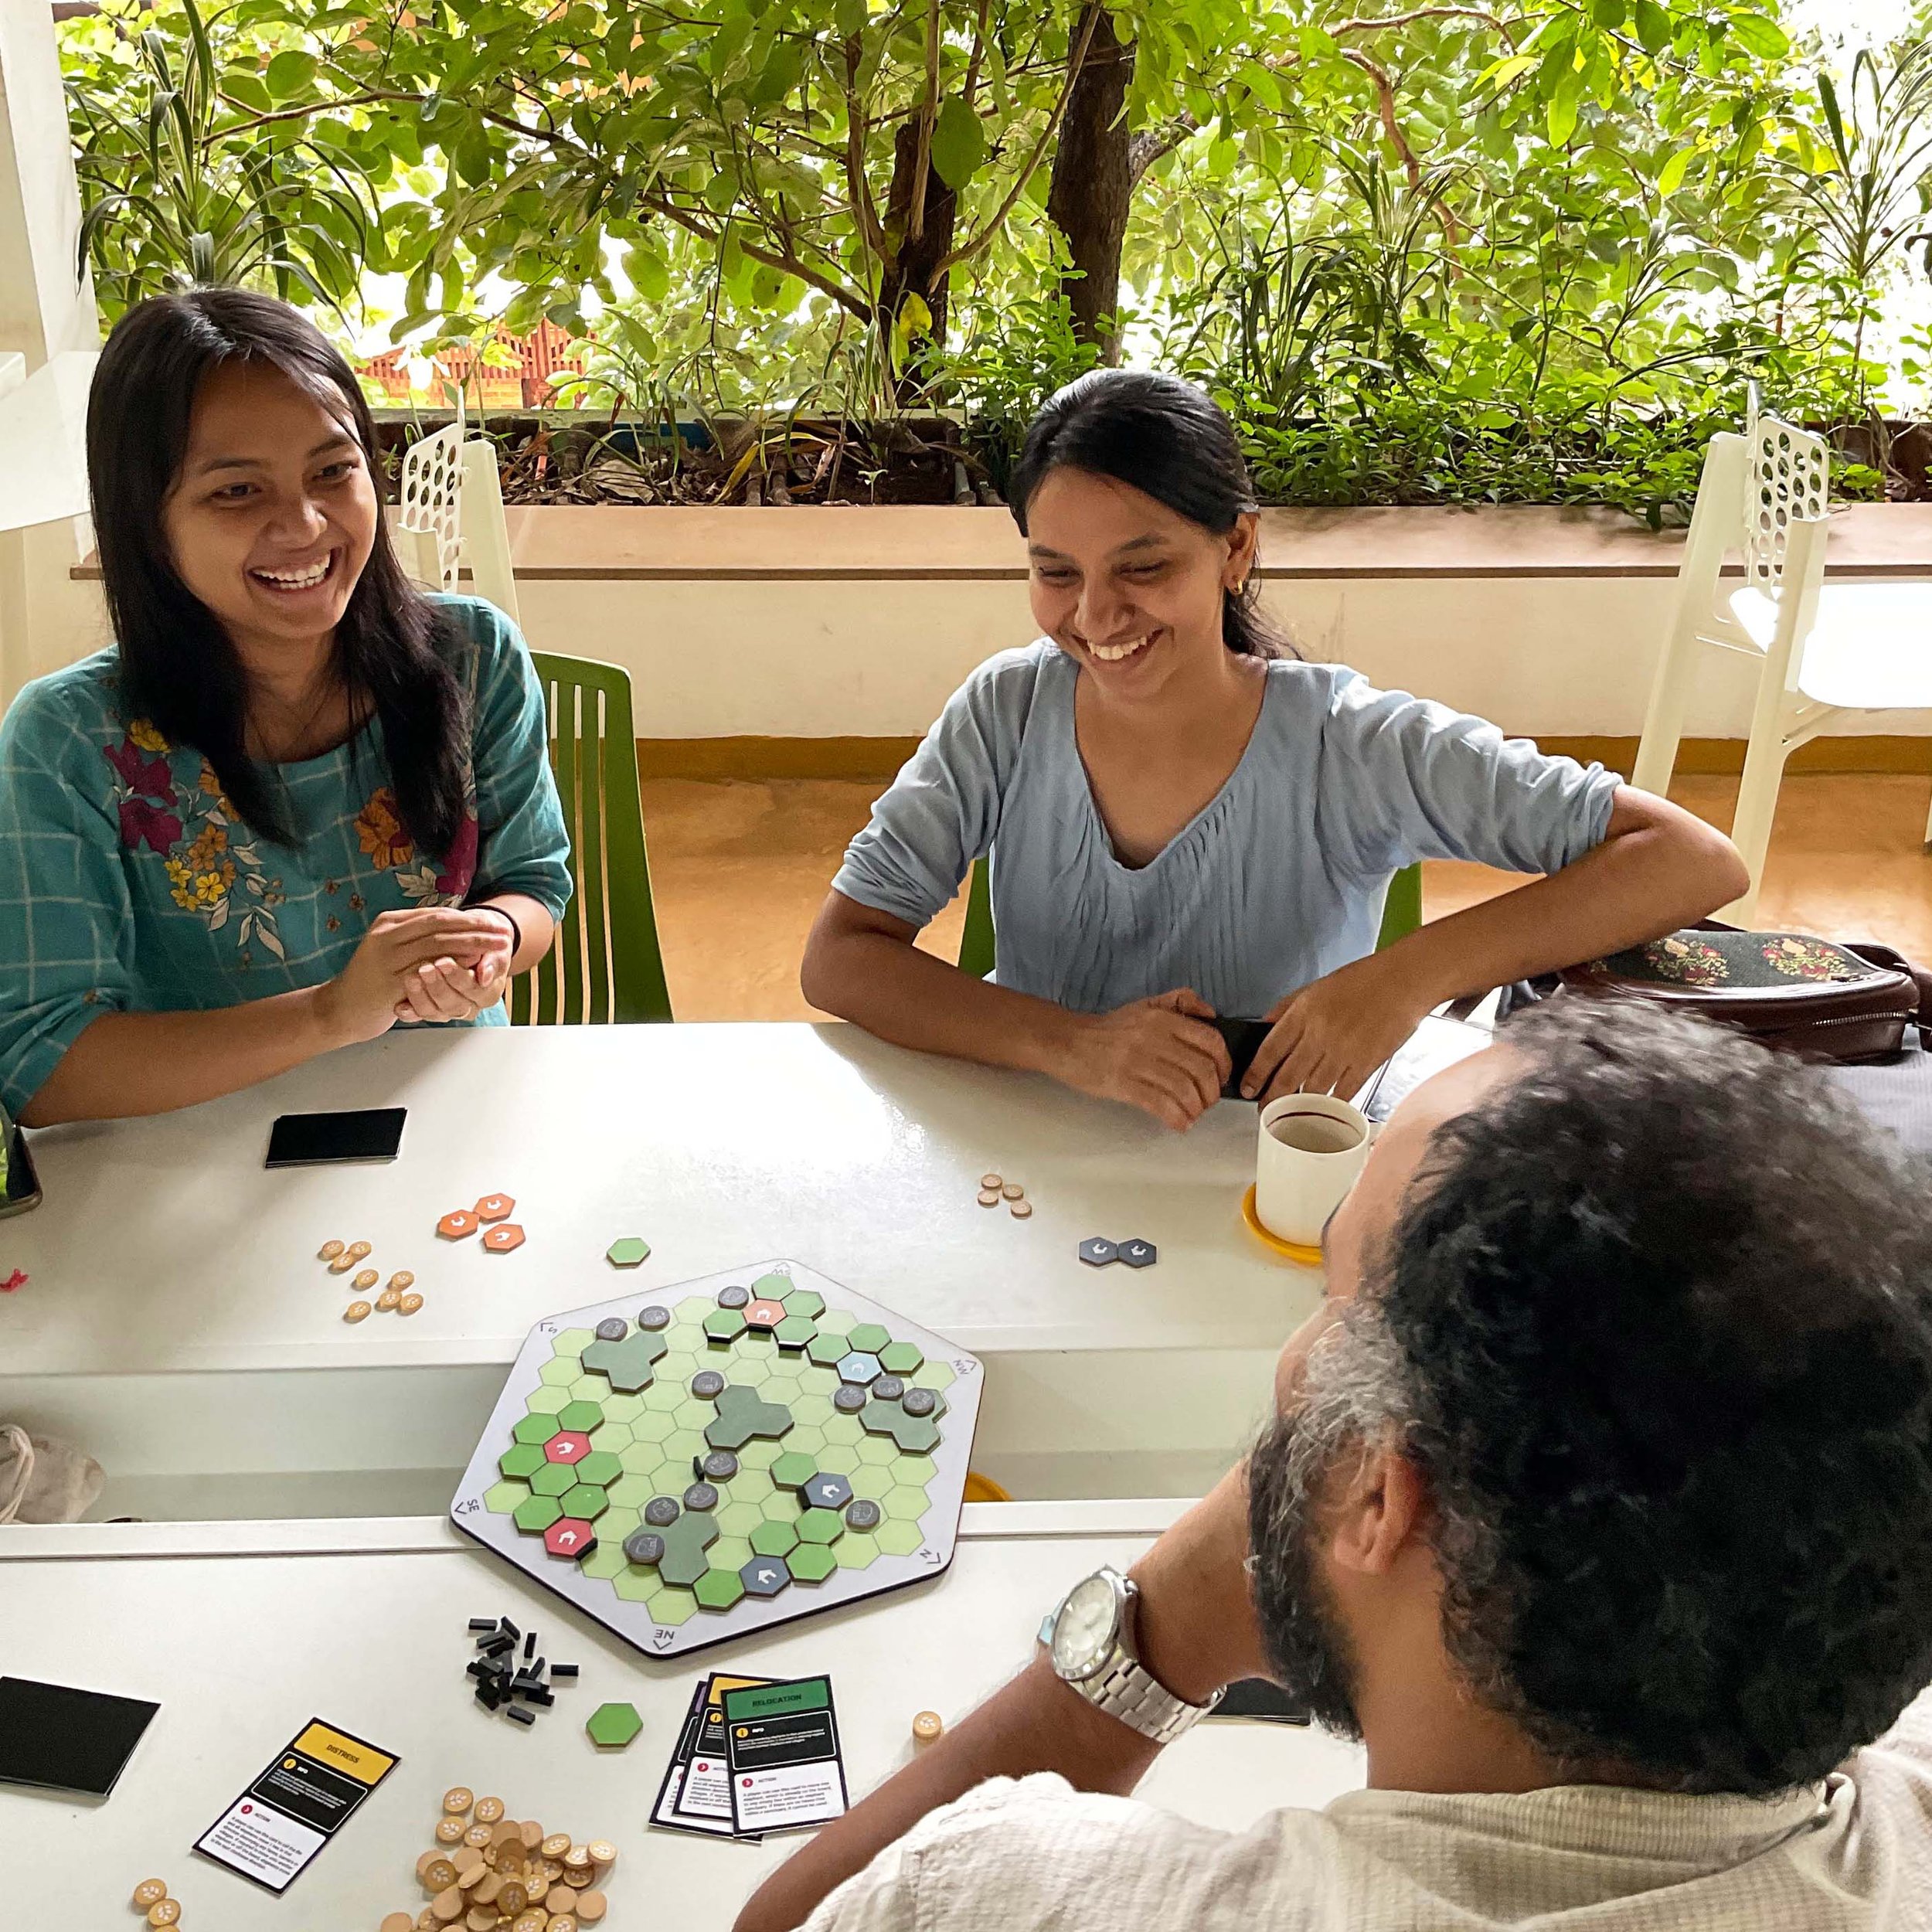
Core-team, June 2023.

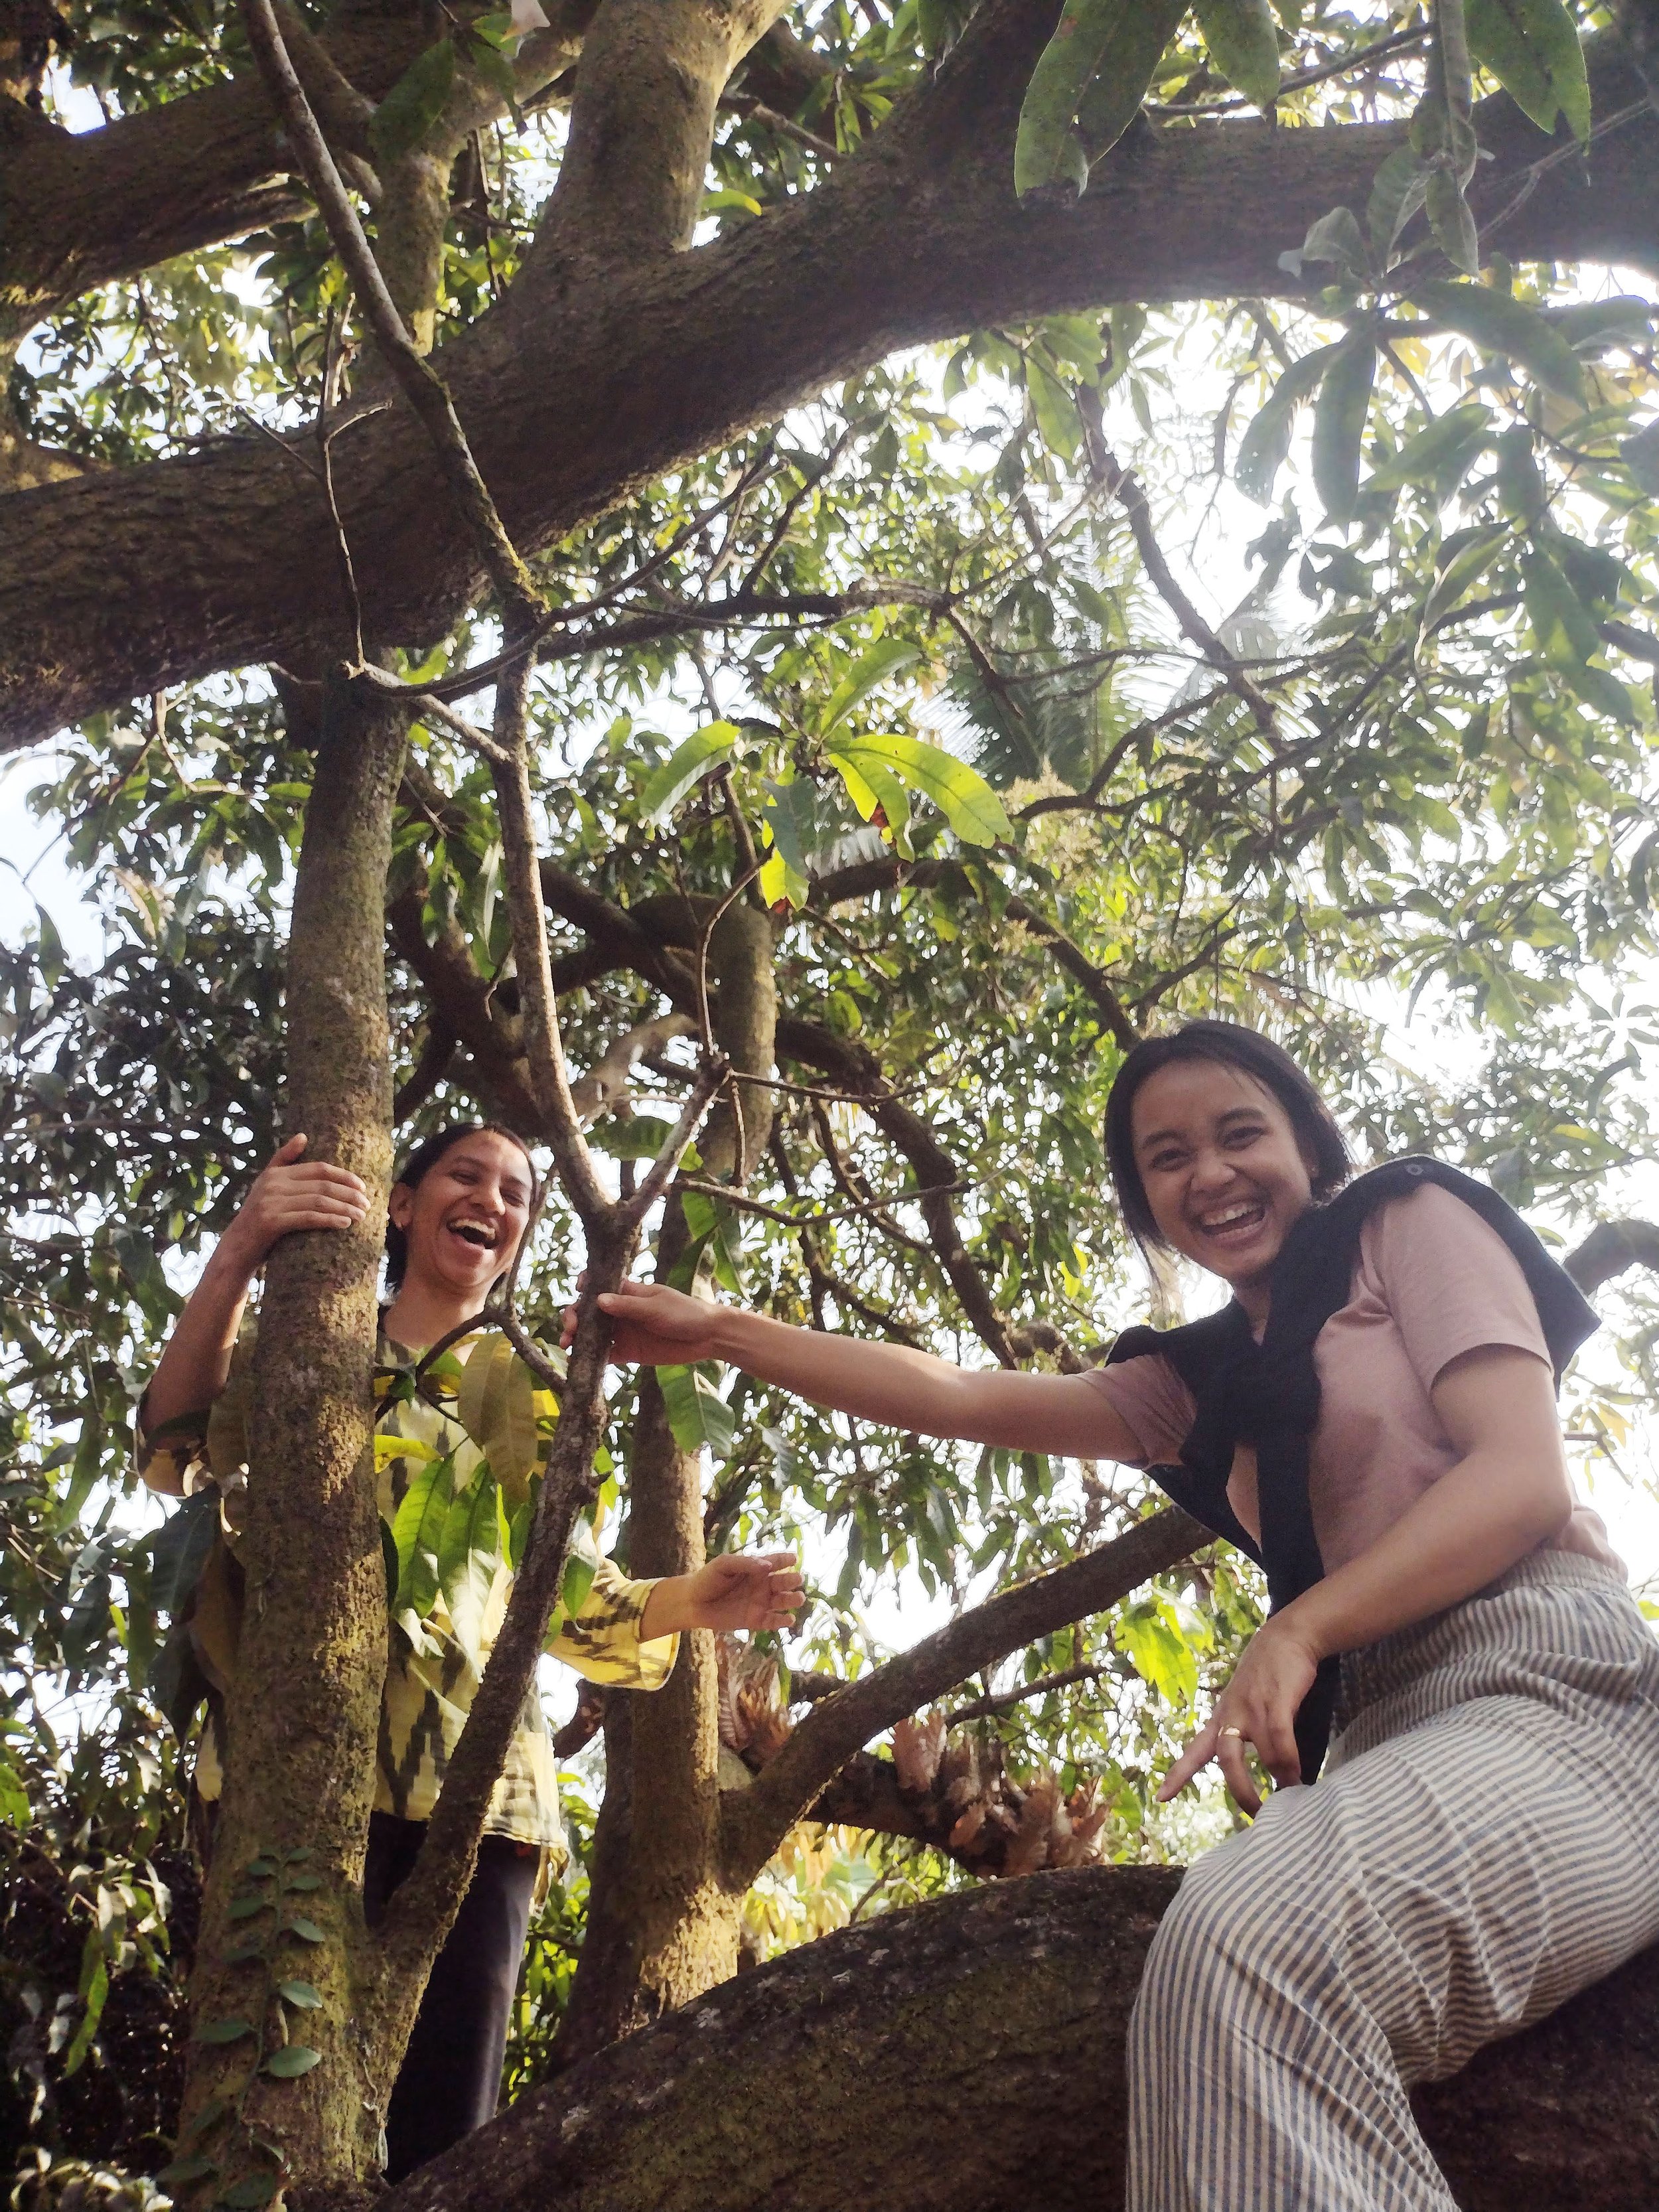
Team in discussion, July 2023.

The projects of course meant little without the team behind them. I cannot adequately describe the incredible resilience, understanding and grit of the team I’m so lucky to be a part of. Each and every person showed determination and growth, both technically and personally. They met commitments and created high quality work while showing endless patience and adaptability with me and changing circumstances. Aditi and Sravanthi upskilled significantly and grew more independent in their tasks. Nancy and Shivangini took on additional responsibilities and workload. These are the things that kept us going in the months since.

Unexpectedly, it felt like the team also grew- we began working with Sandhya Srinivasan as our Director, and our accountant Nikhila Ballal. As the Director, Sandhya Auntie, continued to provide the structural support the organisation needed to keep running as well as immense understanding, and kindness that helped us retain the character and culture of the organisation. Nikhila, our accountant was always a part of our set up but someone I hadn’t previously interacted with. I valued her presence more than ever as provided patient explanations and guidance while making sure our work could continue smoothly.

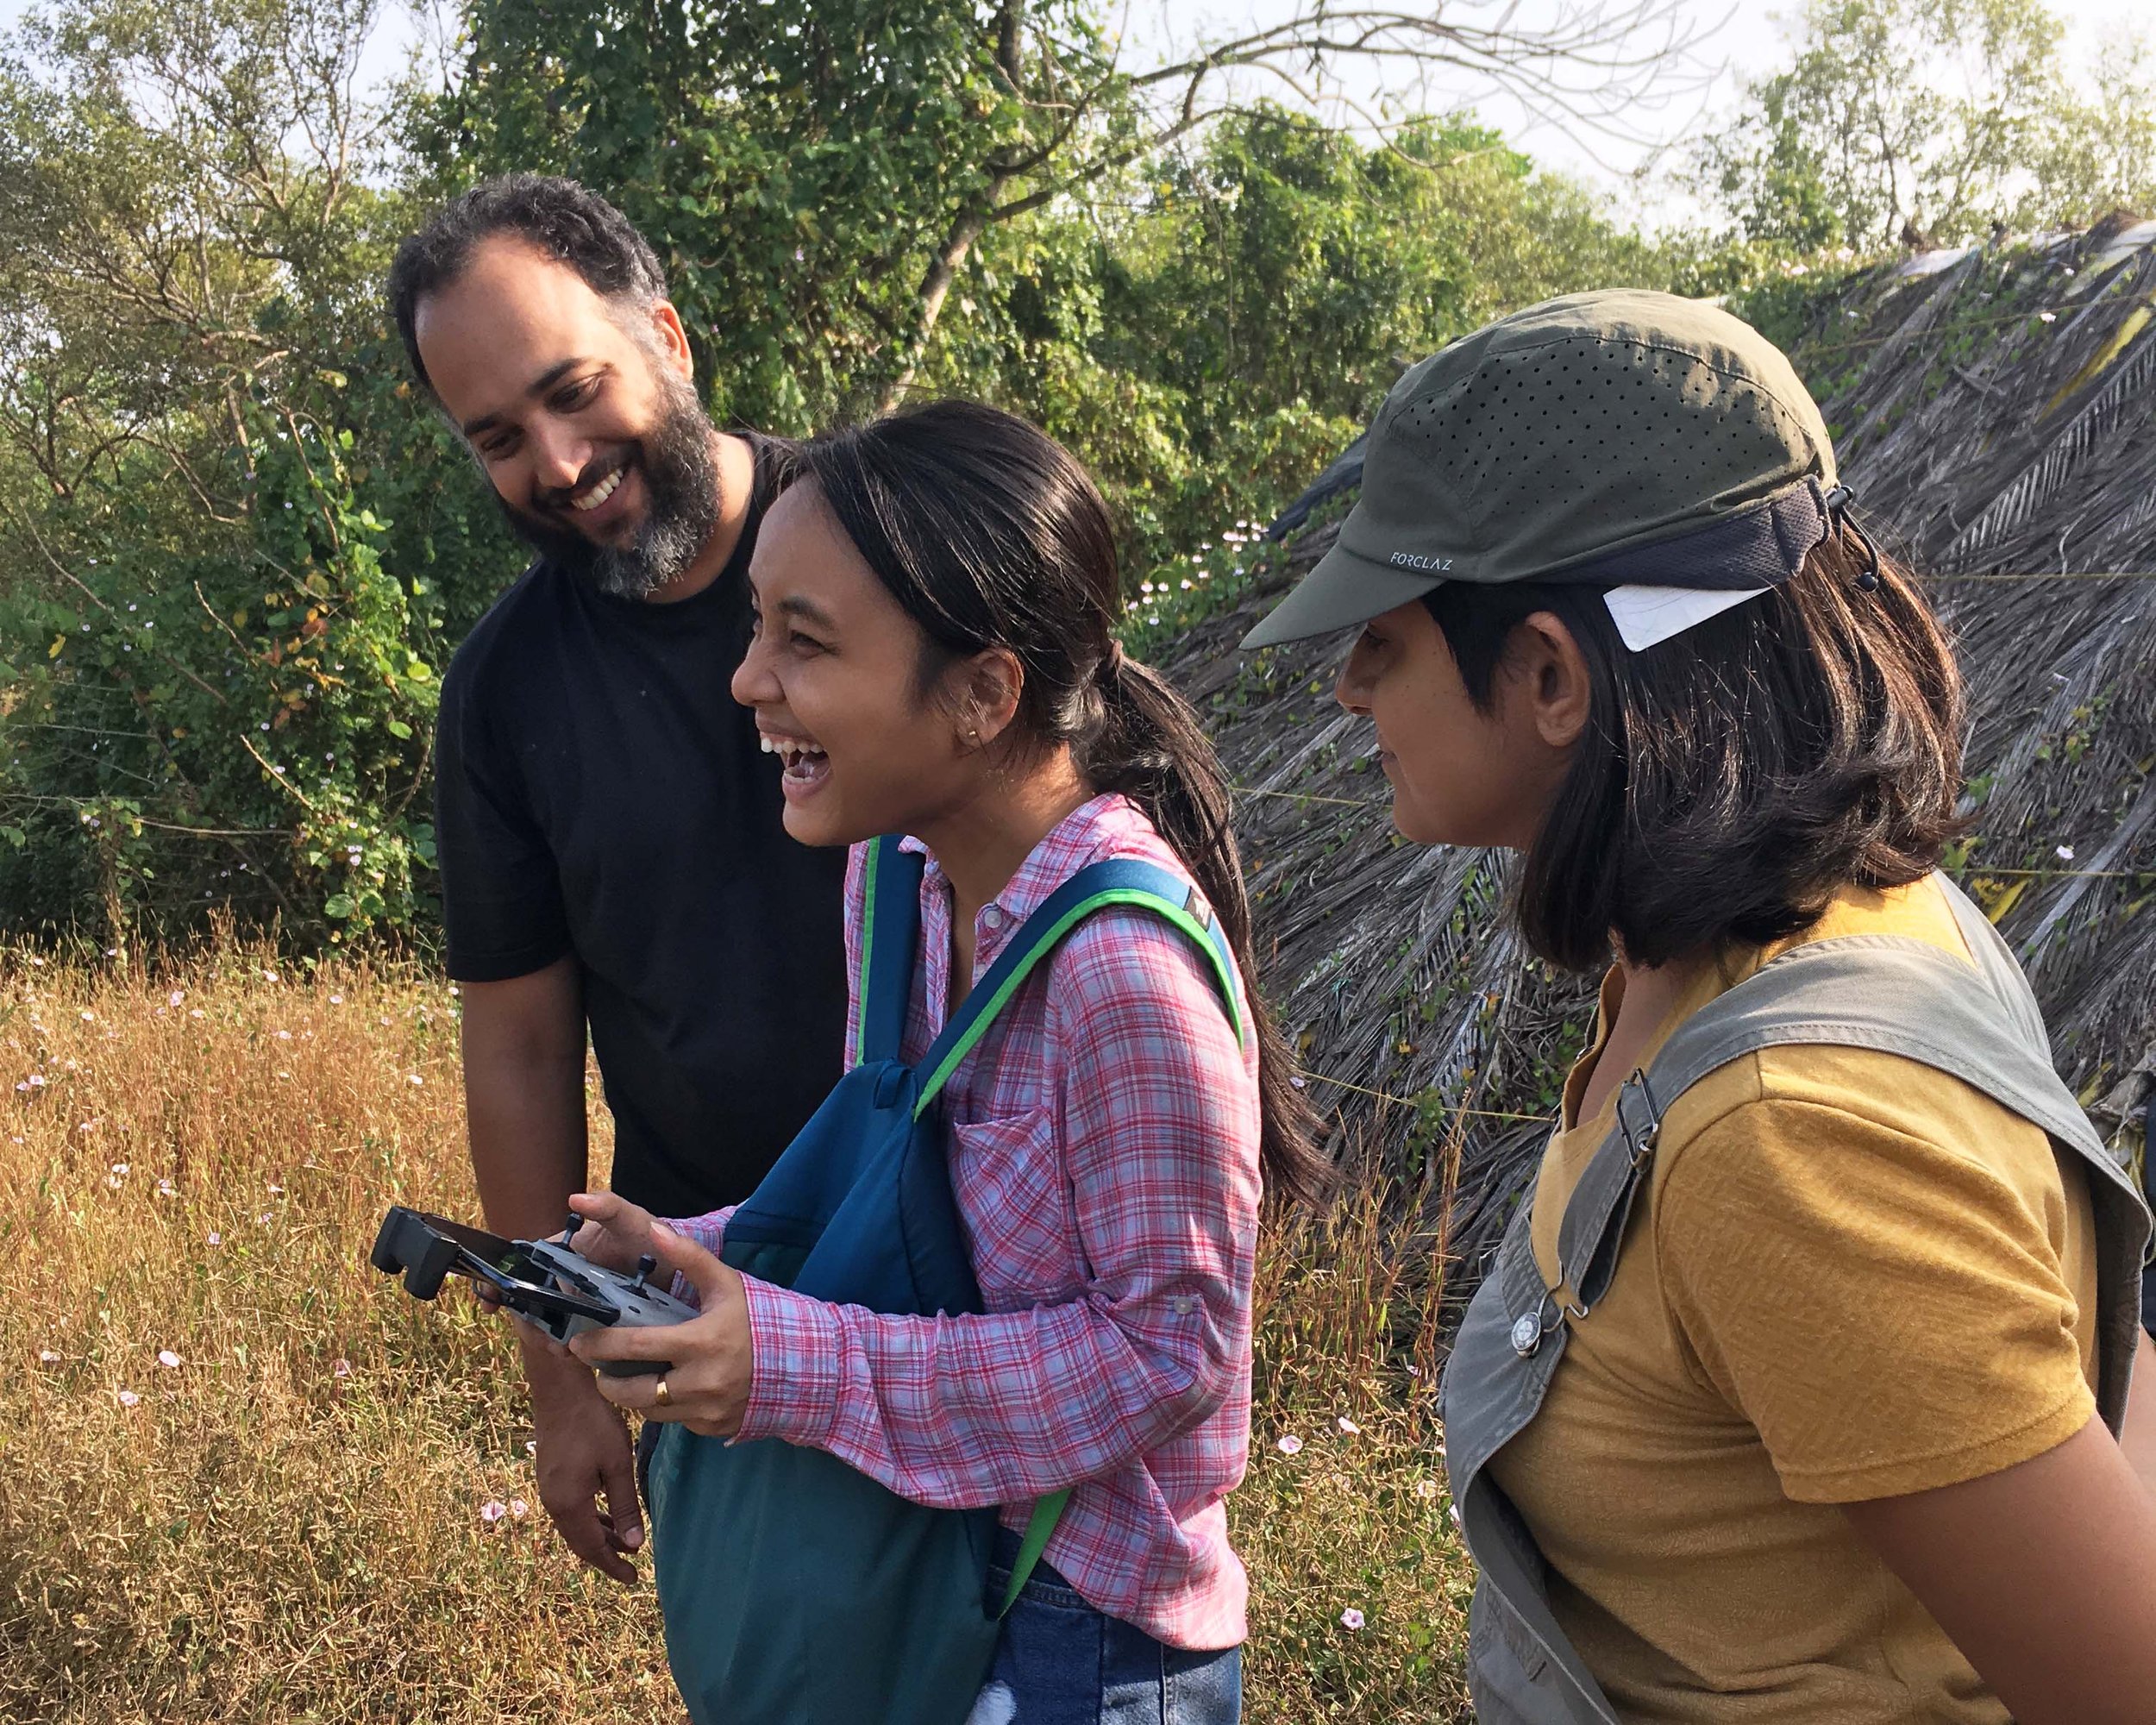
TfW in Mhadei viewing forest fire scars, May 2023.

Without planning for it, it also suddenly became a team composed entirely of women- managing everything from field work and GIS to communication and accounts. It was an unexpected but special and empowering experience for me. To be working in an environment where each colleague was a competent, empathetic and motivated woman was a support and inspiration I never anticipated I would experience, let alone this year. I know this is a rare phenomenon in any field, and it has significantly helped ease some of the difficulties in this transitionary period.

TfW in Odisha surveying olive ridleys, March 2023.

What also made it possible for us to keep working was the stable support and patience from our donors. To have continued belief in our work and ability was immensely reassuring and gave me the confidence I needed to keep going. It also gave us the ability to focus our energies on the work we were doing, rather than anything else.

The conservation community, especially that in Goa, further felt like a safe and valuable ecosystem to be a part of where our worth was acknowledged, and support extended. Trust, built over years was tangibly felt and helped us to continue to feel a part of the community in which we work. 

Professionally, for me the year was of learning to manage and adapt continuously. It was a journey of understanding personal and collective capacity- of knowing when and to whom to ask for help and finding the sparks that keep us motivated. Most of all, in everything, as I deliberated and thought- ‘What would Shashank do?’ I realised just how much difference a single person can make. Like him, every single person in the team has created so much wonderful work and change. This has provided me with inspiration and helpful reminders of what we are capable of.

With this as we begin the new year, more changes are to come and we hope we can continue to create positive change and share this journey with you all!

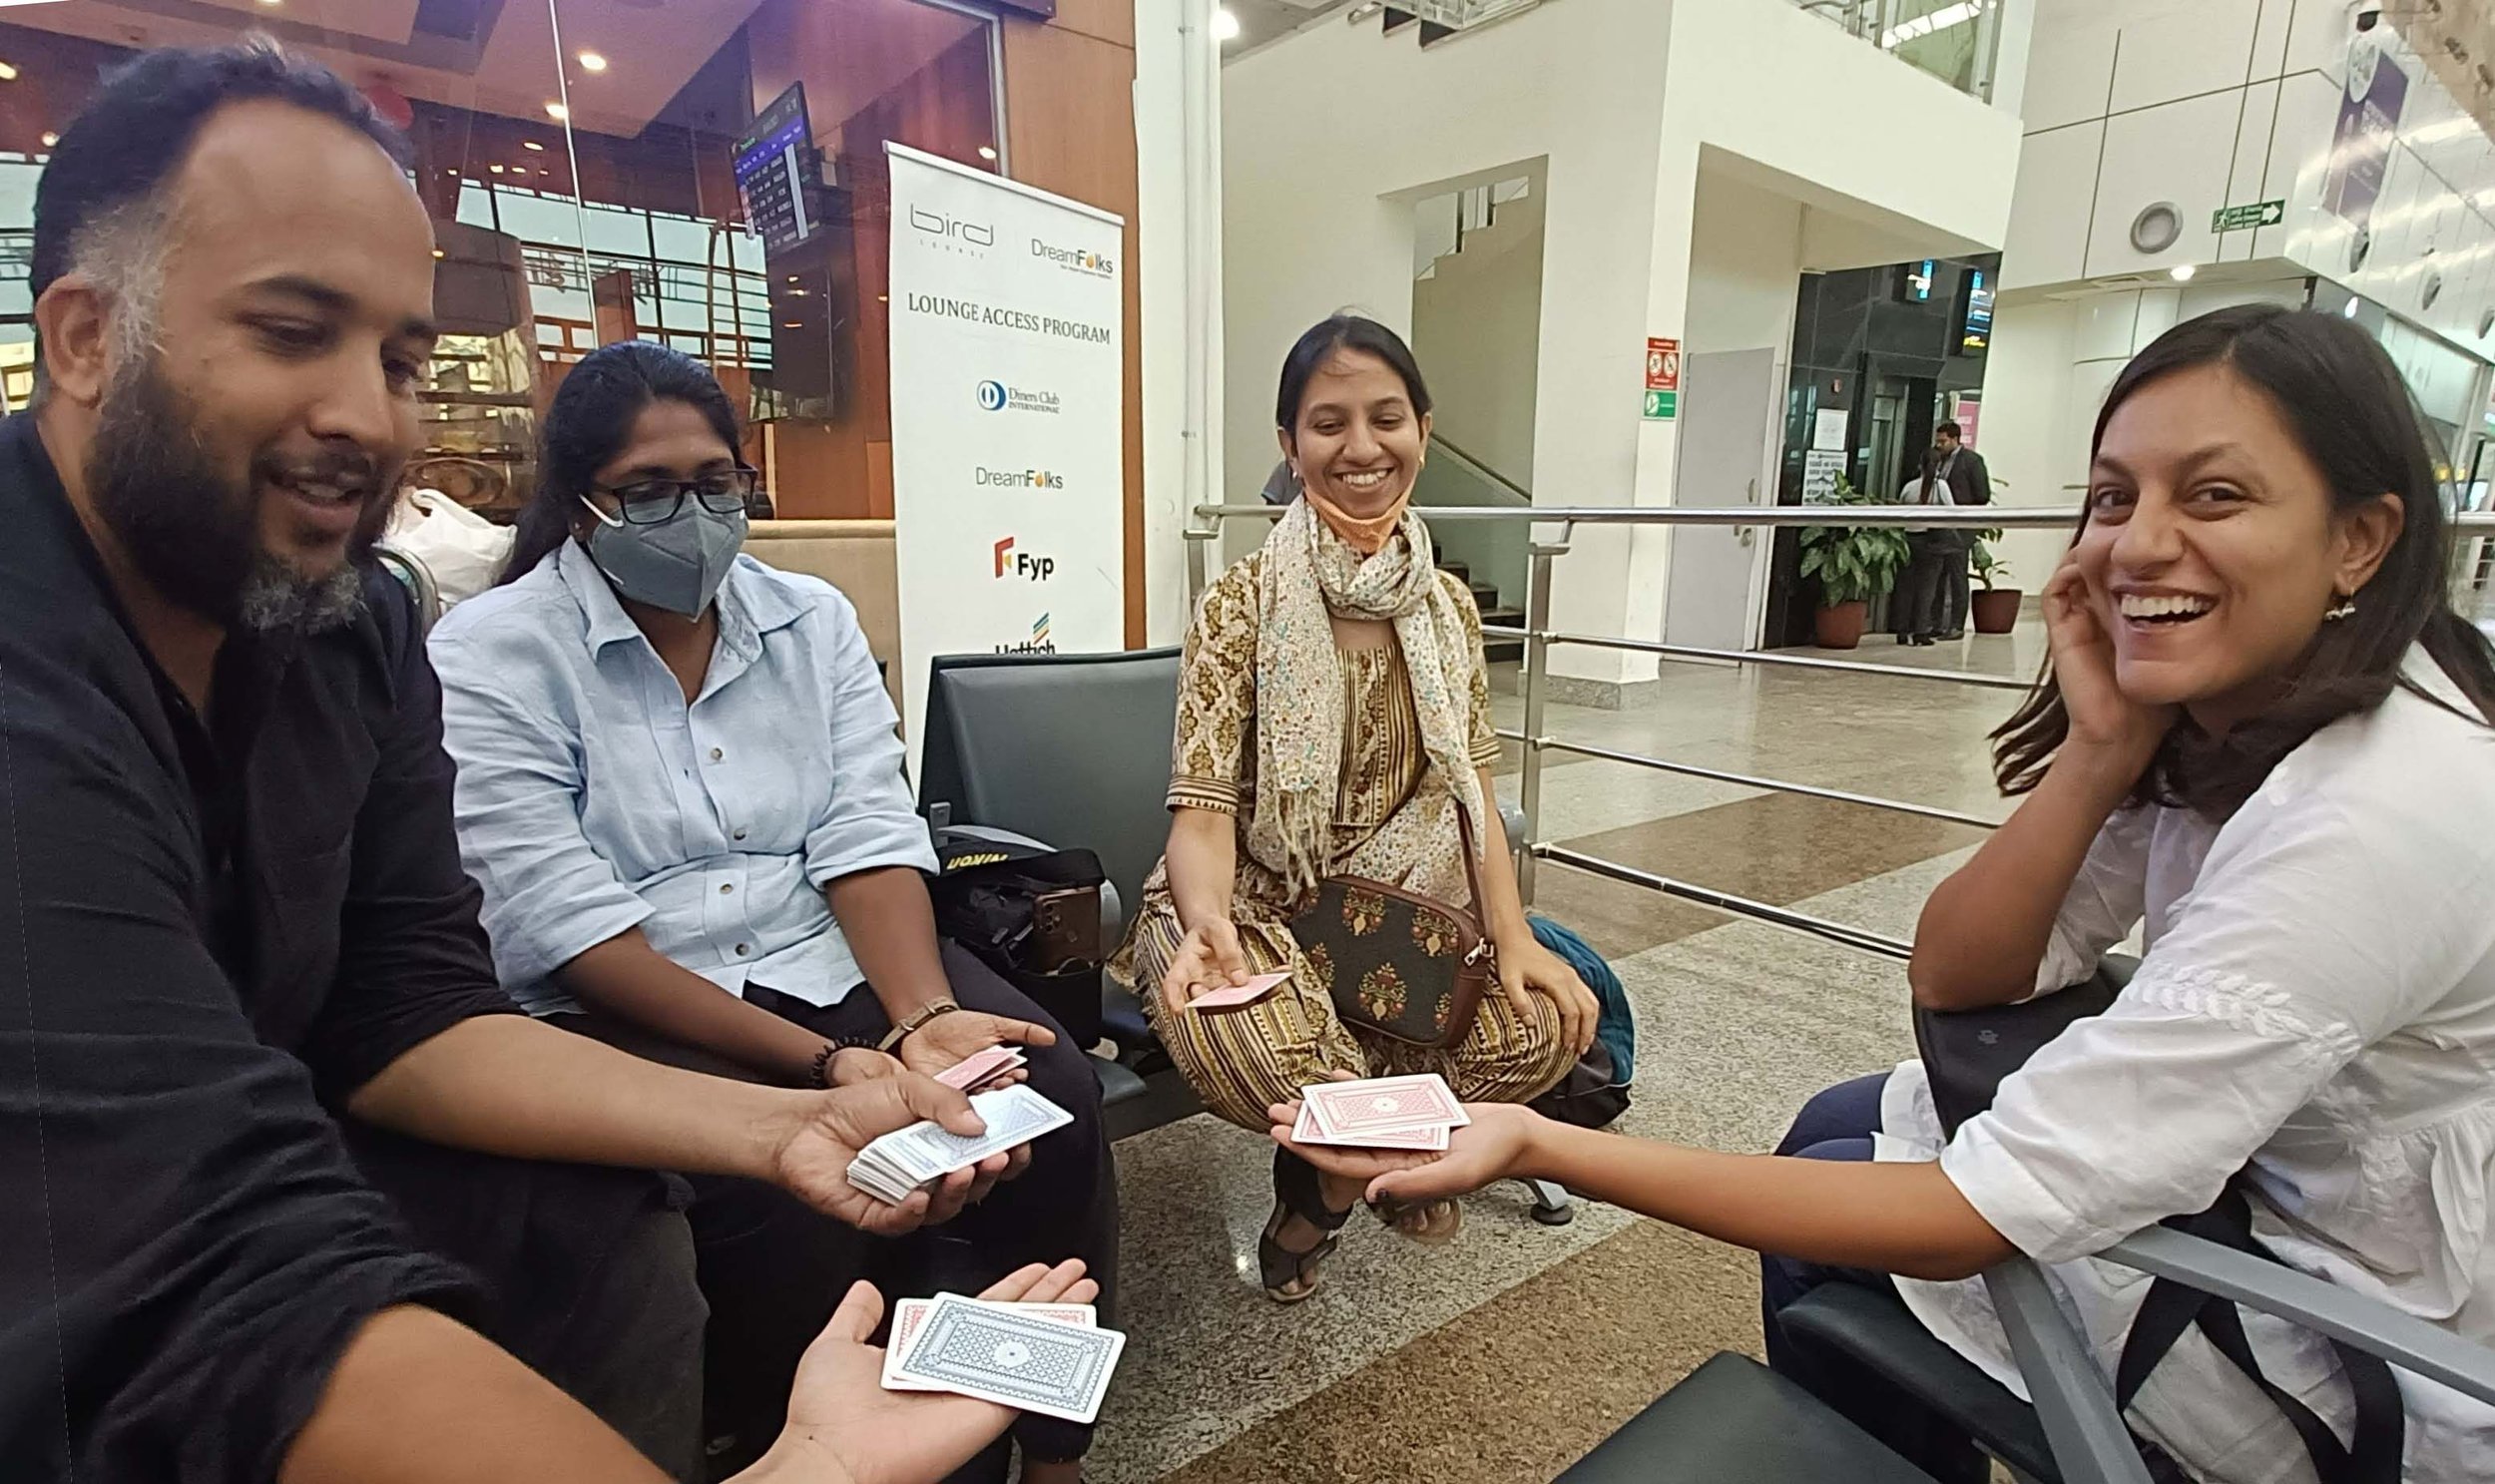
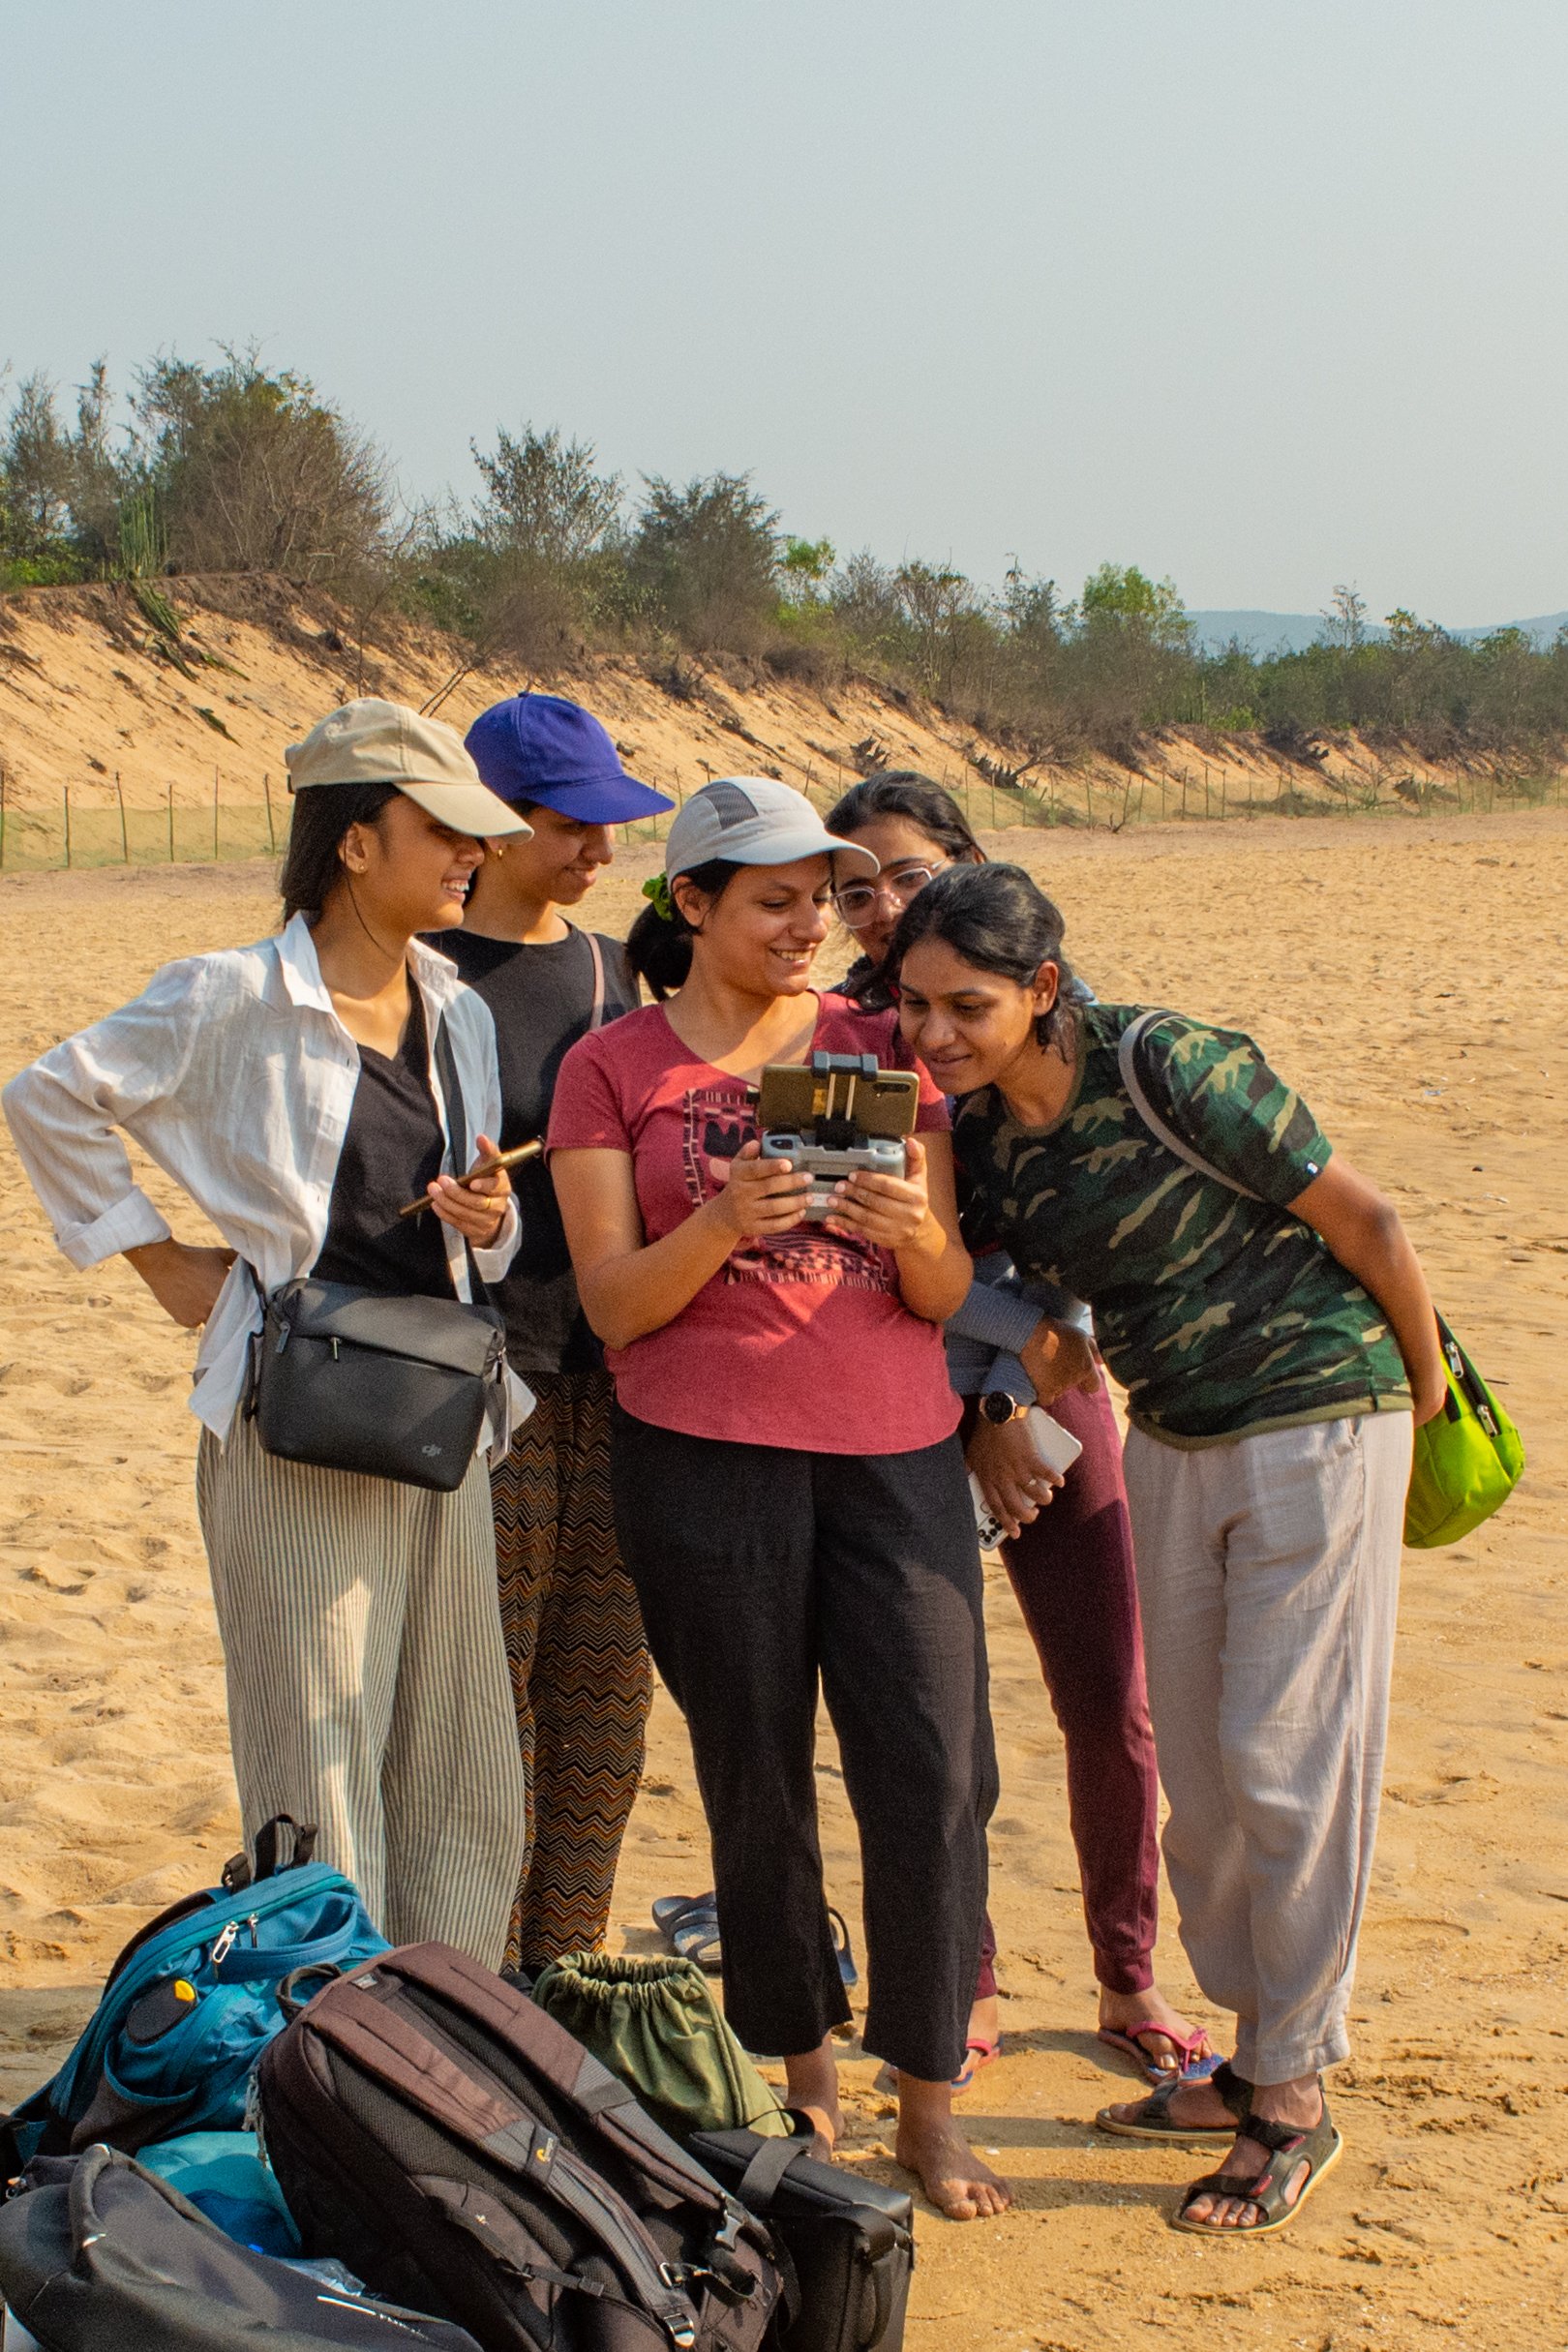
The team sharing a light moment while waiting to board a flight, March 2023.

My First Job: Lessons, Skills, and Memories with TfW

I think everybody very prominently remembers their first job and the experiences that came with it. Similarly, my journey started after I spent the end months of 2021 looking for opportunities, after completing my Master’s education. It was a phase of uncertainty and at times, I did feel anxious. I applied to Technology for Wildlife Foundation but didn’t get selected in the first go. However, I remember I appreciated the hiring process at TfW- mostly because the interaction with the team during interviews was quite warm, and I was happy with my performance in the test they held. I wrote back to Shashank, genuinely appreciating the process, even though I missed the chance to work with them. At the back of my mind, I still looked forward to working with them in the future.

Flying a drone with the team.

Fast-forward to May 2022, in the middle of my ongoing internship, I received an email saying they had a vacancy for the post of Conservation Geographer at TfW and were interested in taking me on board. That email felt like a manifestation (not an exaggeration). I remember jumping with joy and finding it hard to believe. 

Aditi holding her first-ever business cards.

Starting my first job was filled with feelings of excitement and nervousness. It brought with it many changes-; like moving to Goa- a place I had never even visited beforehand, with many firsts- like seeing the sea for the first time, flying kites, trying football and conquering the fear of water. I was worried about fitting in, understanding the office culture, and getting to know my new colleagues. I had heard stories of people not liking their job experiences and somewhat had the impression that maybe that’s how it worked. But maybe hard work and luck worked for me. I met some of the best people there and now have a beautiful experience to share.

Experiencing sunset at the Arabian Sea, another first.

Before joining, my role in the organisation was explained to me. My position was of a Conservation Geographer and I remember during my interview, Shashank asked me “Do you want to do GIS because you like GIS or would you do conservation that has GIS in it?” I chose the second option and got to practise what I was promised.

Learning to use a Remotely Operated Vehicle (ROV).

I got to work with many different organisations, and create maps that lead to tangible changes. Creating maps for Mongabay-India’s conservation stories was one of my longest running commitments in the organisation. The arrival of each story was exciting because of the process- of trying out methods and deciding what kind of map would best depict the conservation story. I remember I felt quite challenged when I got my third mapping task for Mongabay-India which required me to create port boundaries from descriptions. At first, it felt like riddles, but in the end, it was one of my most impactful maps and I am proud of it.

In the beginning, because I was new and developing skills, I was anxious to complete the task that I was given and ended up working long hours. Shashank, who I was reporting to, checked on me because working longer hours or on weekends is highly discouraged at TfW.  I was taught to have a work-life balance and to focus on myself along with the job. One of the most valuable aspects of this experience was the relationships that I formed. This job introduced me to wonderful people- my colleagues who were also mentors, as well as others working in the field of conservation. 

Climbing trees on a field trip.

I wouldn’t have ever imagined all these possibilities without this platform, a vision that Shashank brought to life. This was made more unique because of the team- mostly women- working together through thick and thin. Even though our work is technological, there was nothing robotic about the team. It was built as a safe space filled with warmth, learning, and encouragement to do amazing work. Even though I now bid adieu to this organisation, I will be forever grateful to the team, for the experience I got here and for setting my standard so high.

Play-testing a board game with the TfW team.

Mapping Floods: Exploring Thresholding Methods

As part of our collaboration with Mongabay-India, we have utilised spatial analysis and visualisation to accompany their reporting. In June 2023, they published an explainer by Vinaya Kurtkoti on floodplains and their management in India. Their article discusses the ongoing process of concretisation and development in floodplains, which reduces the carrying capacity of rivers, leading to urban flooding. 

Presence of water bodies in Mahad pre and post-flood event.

We received information from the Mongabay-India team on urban floods in different parts of India. The data spanned periods exceeding ten years as well as recent occurrences. The task was to create maps of the areas before, during and after each flood event. Availability of suitable satellite imagery was key for creating these maps. This was a challenge as cloud cover during monsoon season - when the floods occurred was often 90% or more.  Thus the initial, critical step towards creating these maps was to check if clear imagery existed for the required flood dates. Additionally, for events older than a decade, the issue of low resolution imagery arose. Initially we planned on showing the flood visually using the raw satellite images. Since we found no clear imagery for the flood dates, we had to look for other options that could depict the flood-prone areas. 

Given the lack of clear imagery for the flood dates, I explored alternative approaches to represent flood-prone zones. Three distinct thresholding methods were experimented with, using three different platforms. 

The first method involved utilising Digital Elevation Model (DEM) data in QGIS, an approach that came into play due to QGIS’s simple interface. By loading the area of interest through quick map services and employing the SRTM-downloader plugin, DEM 30m data was directly sourced from NASA Earthdata. I used the DEM data to establish a threshold. This method is a prediction of flood prone areas, given the level of water level rise. I looked for sources like news articles that reported the water level when the areas were flooded. I set that water level as the threshold using the raster calculator. By setting that threshold the algorithm gave the areas based on the elevation that would be inundated, if water level rises to a certain level.

Thresholding flood level from SRTM DEM data.

The second method I tried was using Sentinel-1 Synthetic Aperture Radar (SAR) data, which was available for the exact date when the flooding occurred in this area, using Google Earth Engine (GEE). 

I then analysed pixel values of water by comparing images before and during flooding. Applying a pixel value threshold allowed for identification of sudden changes indicative of flooding. I began by filtering the pre-flood and post-flood dates for the images for Mahad city. So, I had two SAR images: one before the flood and one when it was flooded. I checked the pixel values of the water bodies before the flood from various spots. This pixel value was then set as the threshold. Once I input the threshold and ran the code, GEE highlighted areas with sudden pixel value changes of water bodies in the after image, indicating flood, and those with no change were the existing water bodies. 

Pixel value change of the area marked in red from pre-flood to flood date in the Inspector display box.

The third threshold method I employed was for the Commonwealth Game Village area of Delhi. Initially, we hoped to depict actual visuals of the flooding in one of the areas using satellite imagery. However, demarcating the flood manually for the viewers to clearly differentiate between the pre and post-flood imagery was not possible because clear imagery was not available for the flood dates. When working with older satellite images dating back to 2010, we faced issues stemming from their low spatial resolution. This limitation arose because satellites with enhanced spatial resolutions were launched only after that time, in 2013. In order to show a similar situation, we searched for similar events in recent years and found images from 2022’s flood in Delhi. However, satellite images during the flood were still not useful because of the high cloud cover in them. So I had to look for images just after the flood event when the cloud cover was low but was still indicative of flood, as it takes time for the water to drain away. 

Initially I tried the same method as before, by using SAR data. However, it seemed to detect built up areas like roads instead of water. Therefore I switched to Sentinel-2 L2A data for this region. According to Bhangale et al., 2020 [1] and Lekhak et al., 2023 [2] band 8 (NIR) with band 3 (Green) of Sentinel-2 could be used to identify water bodies. I therefore used the band 8 from both the pre and post-flood images to detect inundation. I checked the pixel values from various spots and noted down an approximate minimum and maximum pixel value of the water body in the image before the flood. This range was then used to differentiate water from non-water areas in post-flood images. After noting the values, I classified this range of values into one category as water and rest as not-water. I similarly applied this step in the post flood image which gave me the change in the water bodies which are the areas that were inundated. 

Checking pixel values of water bodies from pre-flood images.

Setting threshold values to classify water and not-water.

Results after classification.

After applying all the three thresholding methods the question that arises is of their accuracy. While the first method that I applied was a prediction based on elevation and level of water, the other two methods were entirely based on satellite data. 

In the case of Mahad, the first method based on elevation seemed to match the level of inundation to some extent with the SAR output, as it predicted the major areas that were inundated. SAR data, as per existing studies, is widely used and considered appropriate, for detecting floods as it is unaffected by cloud cover. This is because unlike other optical satellite imagery it is able to differentiate land and water contrast easily. However, SAR data [3] can sometimes misclassify shadows of tarmac areas with buildings and roads as water. This issue became evident when I experimented with SAR data in the Delhi case. 

Presence of water bodies in Yamuna floodplain, pre- and post-flood.

On the other hand, Sentinel-2 data gave results similar to the SAR output where built-up areas were misclassified as water. Sentinel-2 data is affected by atmospheric conditions unlike SAR. The process of setting pixel values is more manual, which can be affected by individual judgement, potentially leading to underestimation or overestimation[2].

Sentinel-1 SAR data has been found to have more accuracy in detecting floods than Sentinel 2.  A study by Nhangumbe et al., 2023 [4] suggests combining both the data for attaining higher overall accuracy. 

Overall all three methods provided estimations of the major areas that were inundated or likely to be inundated, fulfilling the purpose of the issue that Mongabay-India wished to convey. Meanwhile, the scope for exploration and improvement remains open!

References

  1. Bhangale, U., More, S., Shaikh, T., Patil, S., & More, N. (2020). Analysis of Surface Water Resources Using Sentinel-2 Imagery. Procedia Computer Science, 171, 2645–2654. (https://doi.org/10.1016/j.procs.2020.04.287)

  2. Lekhak, K., Rai̇, P., & Budha, P. B. (2023). Extraction of Water Bodies from Sentinel-2 Images in the Foothills of Nepal Himalaya. International Journal of Environment and Geoinformatics, 10(2), 70–81.(https://doi.org/10.30897/ijegeo.1240074)

  3. Rahman, Md. R., & Thakur, P. K. (2018). Detecting, mapping and analysing of flood water propagation using synthetic aperture radar (SAR) satellite data and GIS: A case study from the Kendrapara District of Orissa State of India. The Egyptian Journal of Remote Sensing and Space Science, 21, S37–S41. (https://doi.org/10.1016/j.ejrs.2017.10.002)

  4. Nhangumbe, M., Nascetti, A., & Ban, Y. (2023). Multi-Temporal Sentinel-1 SAR and Sentinel-2 MSI Data for Flood Mapping and Damage Assessment in Mozambique. ISPRS International Journal of Geo-Information, 12(2), 53.(https://doi.org/10.3390/ijgi12020053)